

Quick summary: The head and shoulders pattern is a potential bearish reversal pattern that forms after an uptrend, with a central peak above two surrounding shoulders. Traders commonly use a candle close below the neckline to confirm the pattern, with expanding volume providing additional support. Entries might follow the breakdown or a subsequent neckline retest. The pattern’s height helps estimate a potential price target, while stop-loss placement and position sizing control planned risk. False breakdowns remain possible.
What is the head and shoulders pattern?
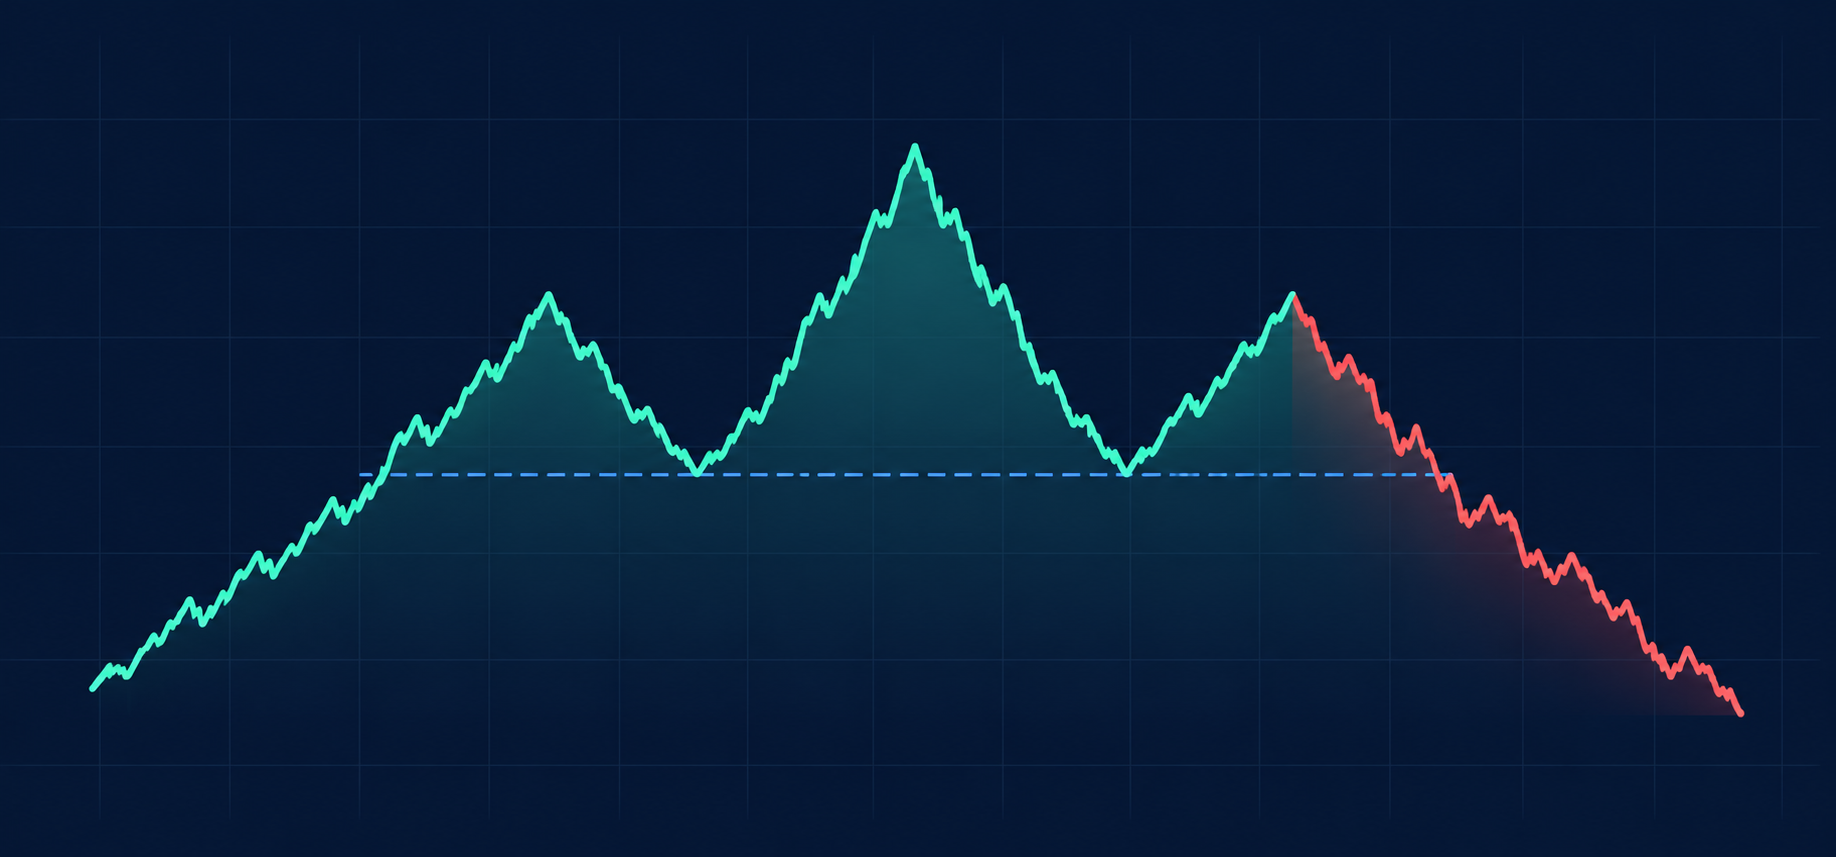
The head and shoulders pattern is a bearish reversal formation that develops after an uptrend. It consists of three consecutive peaks with the middle peak higher than the two outer peaks. Its neckline, shoulder highs, and overall height provide reference points for planning entries, stop-loss levels, and potential price targets.
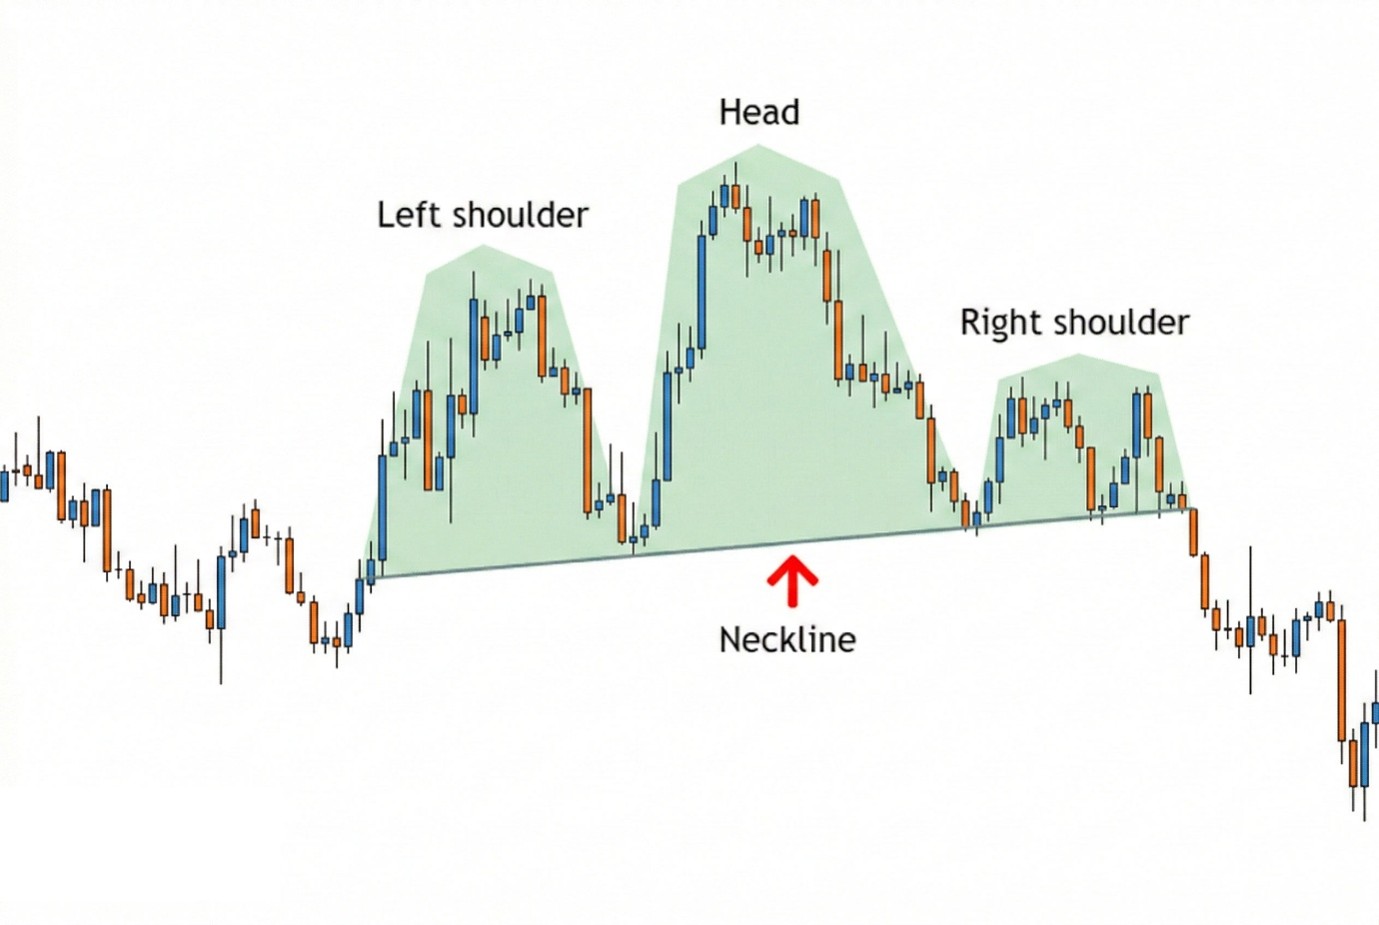
The pattern starts with a left shoulder, indicating a swing high in the market as the uptrend continues. It is followed by a price decline, signifying a period of selling pressure. Next, the head forms when price rallies above the left-shoulder high, then declines toward the area of the first pullback low.
After this, you have the right shoulder: the third peak that forms when price rallies again but fails to exceed the head. It is often near the left shoulder’s height, although exact symmetry is not required.
Lastly, the neckline connects the two reaction lows between the three peaks: the low between the left shoulder and the head, and the low between the head and the right shoulder. Extend this line to the right to identify the potential breakdown level. It can be horizontal, upward sloping, or downward sloping.
Your $30,000 bonus + 10% discount are waiting on Bybit! Sign up and claim these rewards before they’re gone. Time’s ticking!
How to identify a head and shoulders pattern
Look for the following structural features and confirmation signals:
- An established uptrend precedes the formation.
- A swing high and subsequent pullback form the left shoulder.
- A higher high and another pullback form the head.
- A subsequent rally remains below the head and forms the right shoulder, often near the left shoulder’s height.
- The neckline connects the two reaction lows between the peaks.
- A candle close below the neckline on the timeframe being analyzed provides a commonly used confirmation signal. Rising volume strengthens the signal but does not guarantee follow-through.
Assess breakdown volume relative to recent candles on the same exchange, trading instrument, and timeframe. For instance, a trader can compare it with a 20-bar average, provided that rule is defined and tested consistently. Spot and perpetual futures volume reflect different trading activity and should not be treated as interchangeable.
Market psychology behind the head and shoulders pattern
Traders interpret the head and shoulders pattern as a possible shift from buying pressure to selling pressure. In an uptrend, the buyers push the price higher with strong momentum, forming the left shoulder. Once the momentum begins to slow, the first signs of weakening demand appear. Here, buyers make a final push, driving the price to a higher peak at the head, before price falls again.
The right shoulder forms when another rally fails below the head, which suggests weaker buying pressure. Traders often interpret this as difficulty extending the uptrend. A neckline break may attract further selling, although the chart alone cannot establish who is trading or why.
What does the head and shoulders pattern signal?
The head and shoulders pattern carries a bearish bias, signaling a potential trend reversal. The neckline break suggests that support has failed and a decline can follow. It does not establish how far price will fall or guarantee that the broader trend has reversed.
Define the entry condition, invalidation level, position size, and exit plan before opening a position. A neckline reclaim can undermine the bearish setup even after an initial breakdown.
Important Read: Understanding The Inverse Head and Shoulders Pattern in Crypto Trading
Where does the head and shoulders pattern appear?
The head and shoulders reversal pattern forms after an established uptrend. Resistance levels and extended price moves might provide additional context, but they are not required features.
Remember, not every three-peak formation is a head and shoulders reversal. A similar shape inside a sideways range might lack the prior trend needed for that interpretation. Strong catalysts can also overwhelm a technically bearish setup.
The head and shoulders pattern can appear on intraday, daily, and longer-term charts. When trading on lower-timeframe setups, traders should pay attention to spreads, fees, execution, and short-term volatility. Higher-timeframe charts cover broader price swings but can require wider stops and longer holding periods.
Instead of assuming one timeframe is always more reliable, evaluate performance for the specific market, timeframe, and trading rules.
Key terms explained
How to trade the head and shoulders pattern
A bearish pattern can inform an exit or reduction of an existing spot position. Opening a short position requires an instrument that supports short exposure, such as an eligible margin or derivatives product; an ordinary spot sale only disposes of assets already held.
Entry
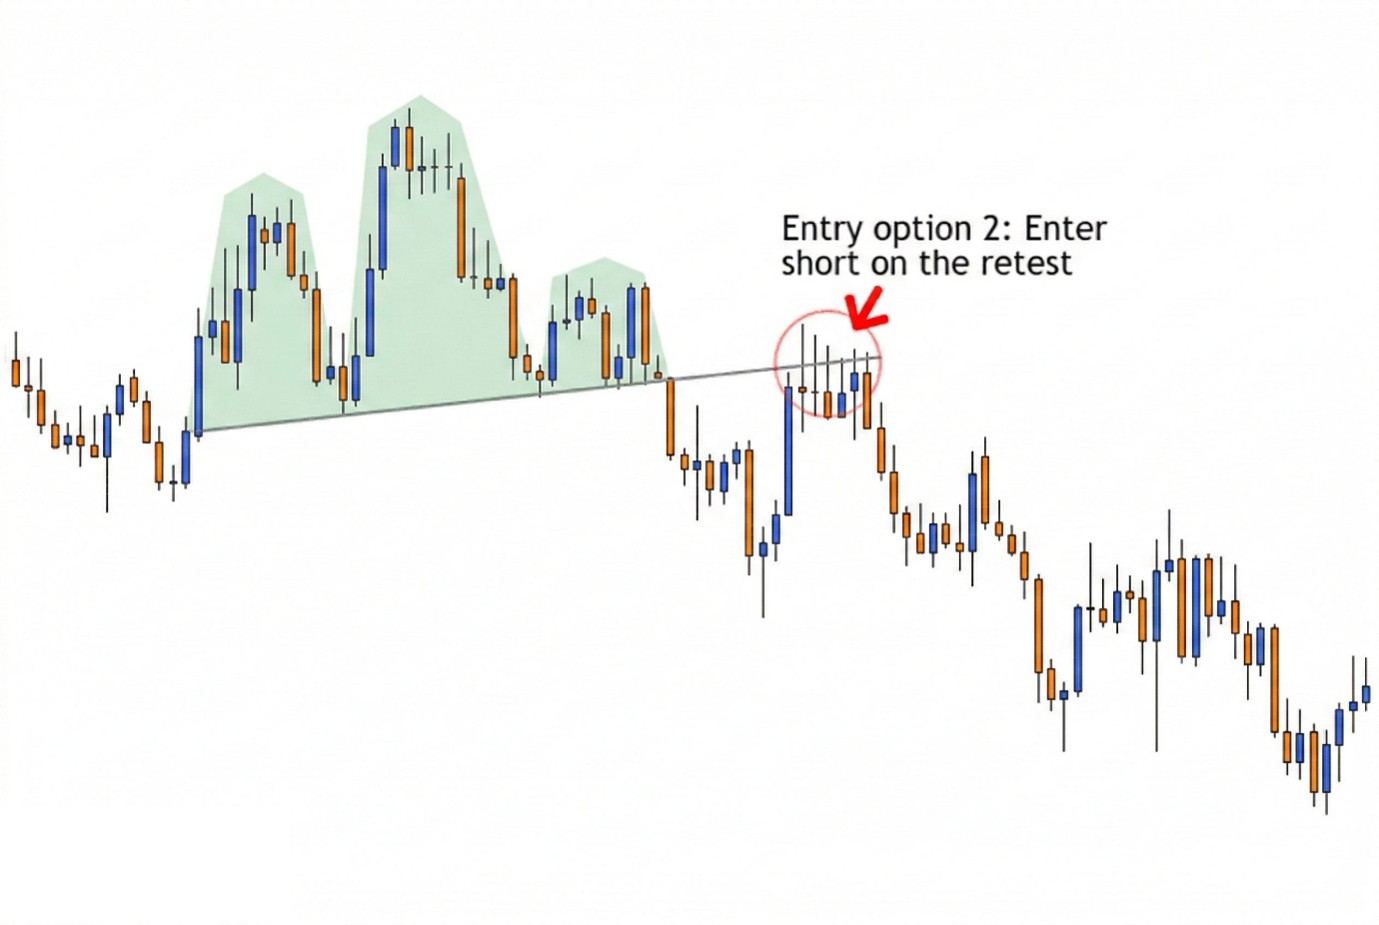
Two common approaches to entering a short position with this pattern are to enter on the break or wait for a retest of the neckline.
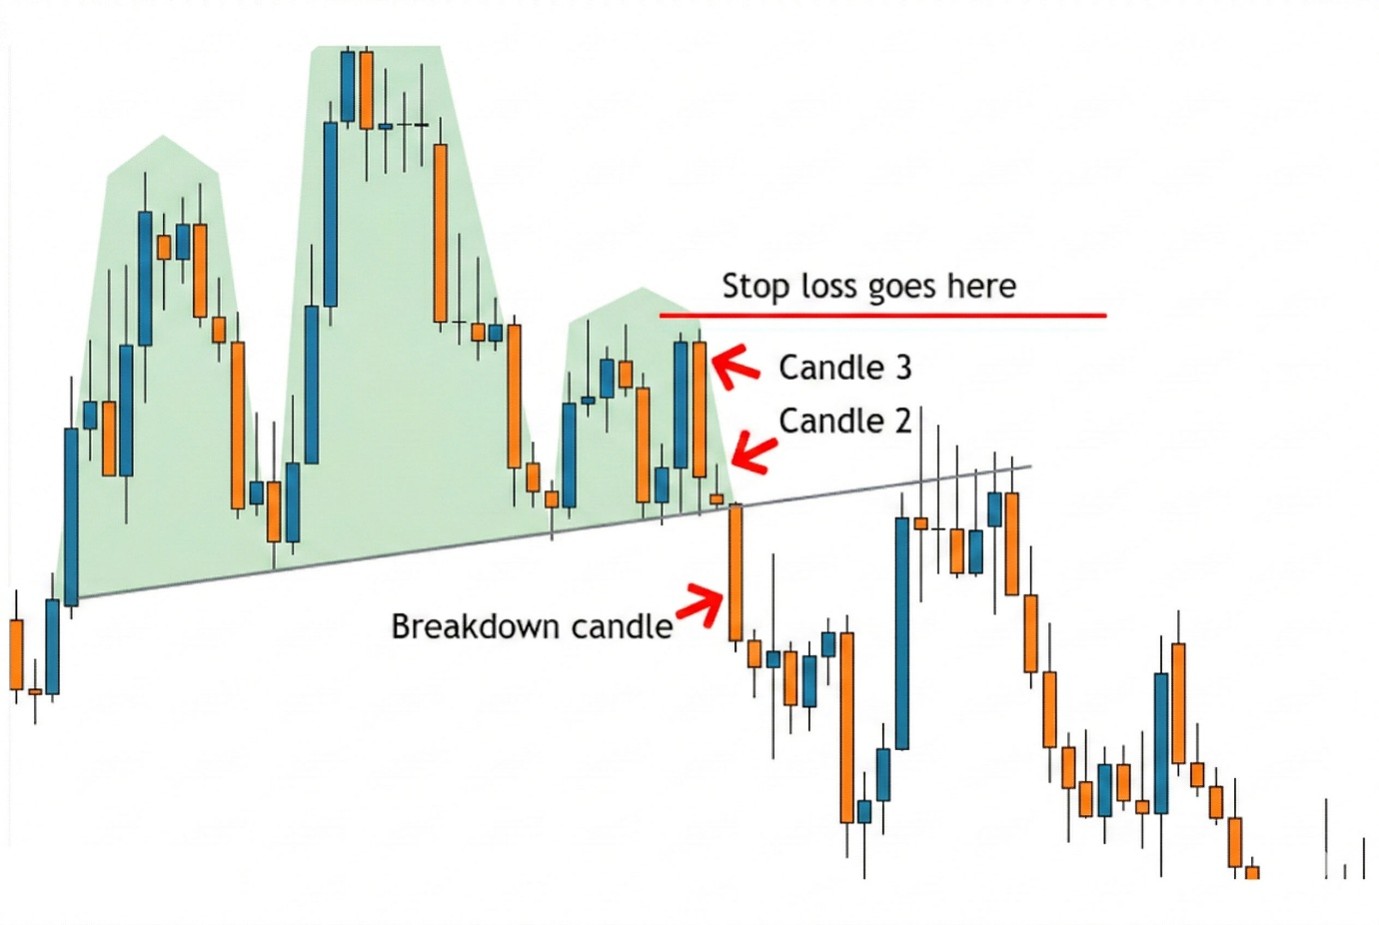
A breakdown entry follows a candle close below the neckline on the setup timeframe. This meets the confirmation rules discussed in this guide, but the breakdown can still reverse. Entering during an unfinished candle is an earlier approach that risks acting on a temporary move below support.
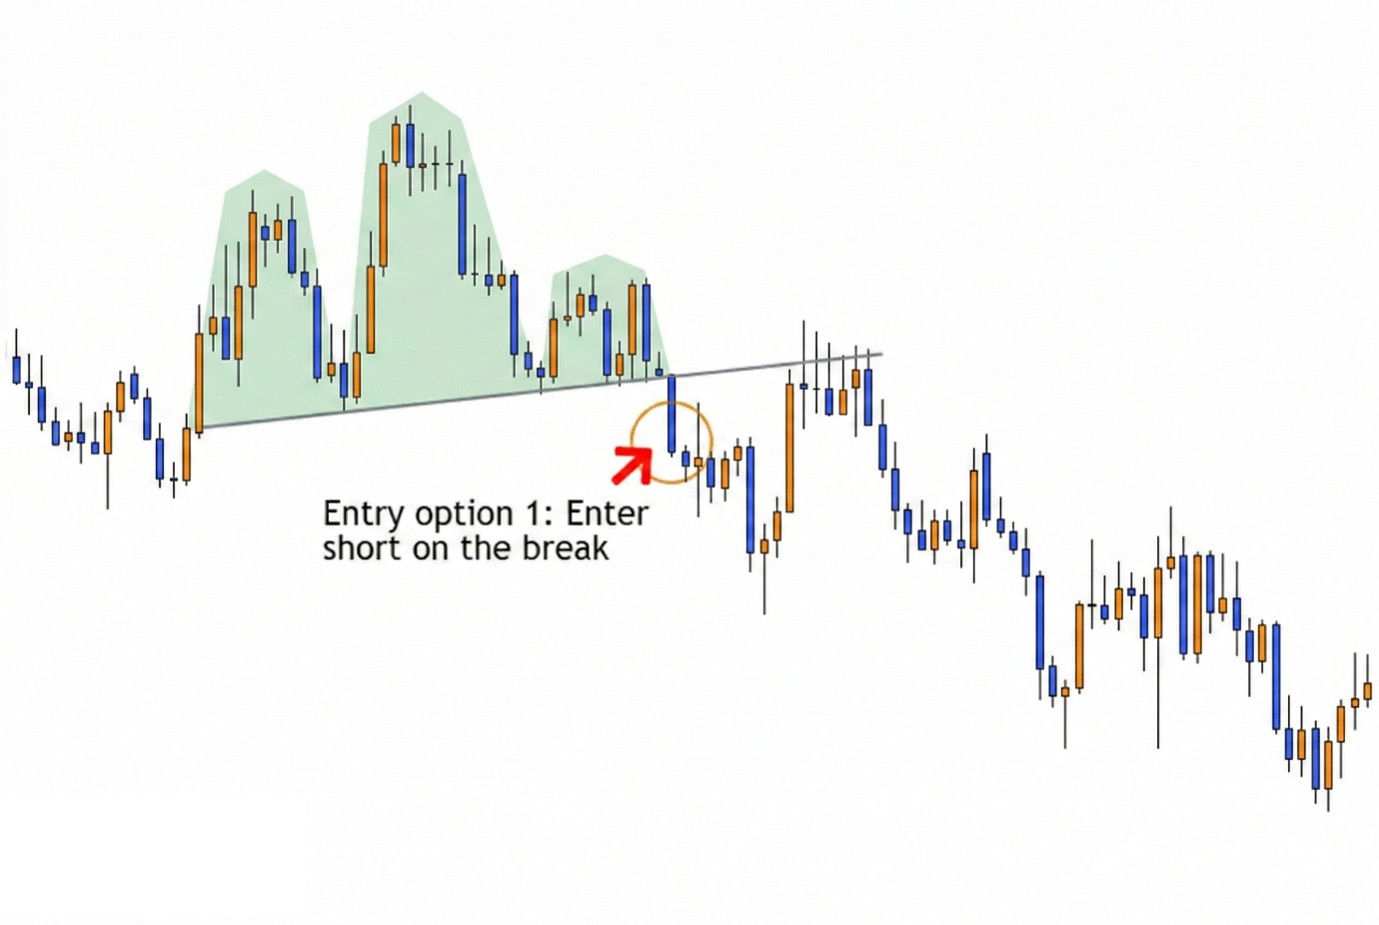
A retest entry waits for price to return toward the broken neckline and show evidence of rejection. For instance, price may test the neckline from below and then form a bearish candle that closes below it.
It can improve the entry price and planned reward relative to risk, depending on stop placement. However, price can continue moving downward without retesting, or reclaim the neckline instead.
Stop-loss placement
Select the stop-loss level before entry using a clearly defined invalidation rule. For a short position, one structural reference is above the right-shoulder high, with a buffer appropriate to market volatility. A retest strategy might instead use the retest swing high. The distance between the entry and stop, together with the planned monetary risk, determines the position size.
Remember, stop execution is not guaranteed at the trigger price. A stop-market order can have slippage, while a stop-limit order can remain unfilled if the market moves beyond its limit.
Profit target
To estimate the profit target using the head and shoulders pattern, traders commonly use the measured-move approach.
- Measure the vertical distance from the head’s peak to the neckline directly beneath it.
- Subtract that distance from the neckline’s price level at the breakdown point to estimate a possible target zone.
Example:
Assume the pattern has a horizontal neckline and the token is quoted in USDT.
- Head: USDT 150
- Neckline: USDT 140
- Pattern height: USDT 150 − USDT 140 = USDT 10
- Estimated price target: USDT 140 − USDT 10 = USDT 13
For a sloping neckline, its level beneath the head may differ from its level at the breakdown point.
Note that the projected target is a guideline rather than aguarantee. Price behavior varies across trading instruments and market conditions.
Apply risk management
Risk management helps traders define their exposure and planned loss before entering a trade. Position size, stop-loss placement, and leverage should be considered together.
- Position sizing: Set how much you want to invest, then calculate the position size using the distance between the entry and stop-loss prices, allowing for costs.
- Stop-loss orders: Help manage losses when the market moves against expectations.
- Leverage control: Keep leverage consistent with the planned exposure and available margin. Excessive leverage can increase liquidation risk.
- Broader market analysis: Assess the head and shoulders pattern alongside volume, the prevailing trend, support and resistance, and relevant market developments. Other chart patterns may provide context, but additional signals do not guarantee a successful trade.
For beginners, set your risk limit before entry and keep it within an amount you can afford to lose.
Important Read: Leverage Trading in Crypto: How It Works, Risks, and Examples
What if the pattern fails?
The head and shoulders pattern becomes invalid when the price falls below the neckline but then returns above it without a sustained downside follow-through. A neckline reclaim can undermine the short setup, while a sustained move above the right-shoulder high provides stronger evidence against the bearish structure.
Before entry, define the exit conditions. A trade’s stop might be reached before the full pattern is invalidated.
In such a scenario:
- Follow the predefined stop-loss or exit rule.
- Avoid increasing exposure just to recover a losing short trade.
- Reassess price structure on the original setup timeframe.
- Wait for a new qualifying setup beforere-entering.
Final thoughts
The head and shoulders is among the most recognizable chart patterns in technical analysis. The pattern offers insights into when the market momentum might be shifting from buyers to sellers. Like other chart patterns, its effectiveness depends on broader market context, such as trend conditions, liquidity, volatility, and supporting analysis.
FAQs
Is the head and shoulders pattern bullish or bearish?
The standard head and shoulders pattern is bearish and suggests a possible decline after an uptrend. The inverse pattern is bullish and suggests a possible rise after a downtrend.
Can the shoulders have different heights?
Yes. The shoulders of a head and shoulders pattern do not need to match exactly, but both peaks should be below the head.
Which timeframe should traders use to trade the head and shoulders pattern?
Use a timeframe that suits how long you plan to hold the trade, then test your strategy on it rather than assuming a particular timeframe is more reliable.
Does price always retest the neckline?
No. Price may keep falling without returning to the neckline, or rise back above it and weaken the bearish setup.
Sign up on WEEX and roll for a chance to win a share of the $1,000,000 prize pool.