


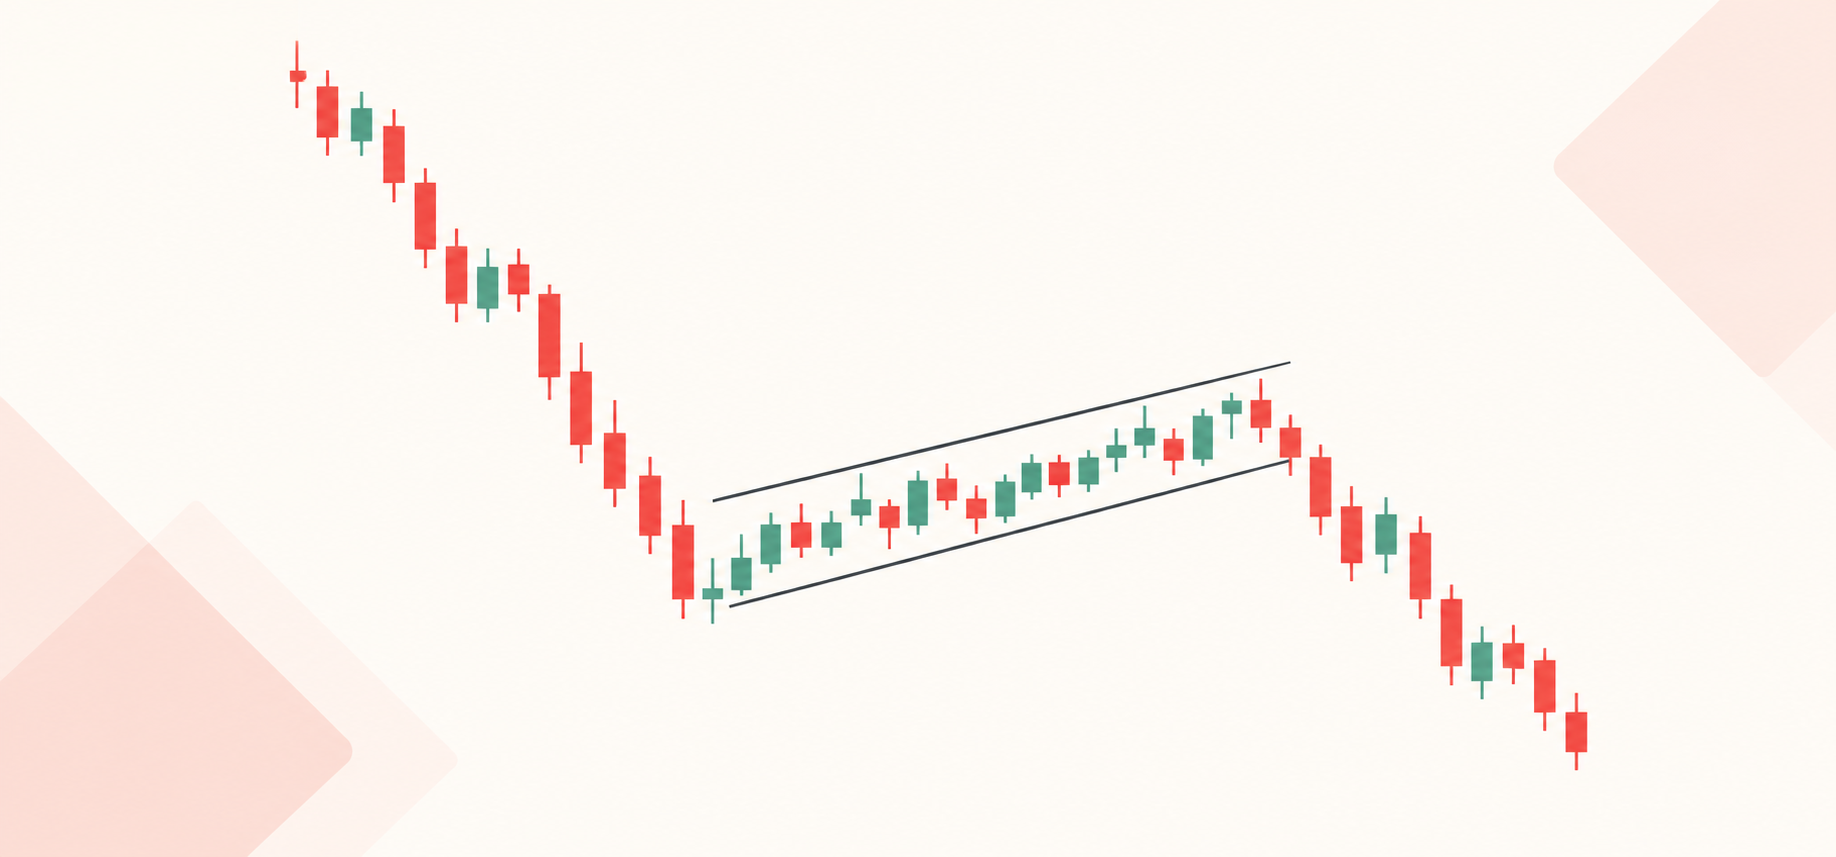
Quick Summary: A bear flag pattern is a potential bearish continuation setup. A sharp price decline is followed by a brief consolidation, usually within an upward-sloping parallel channel. A candle close below the flag support can signal renewed selling, but a false breakdown can occur. Traders use the flagpole length to estimate a downside target and define an entry, stop-loss, and position size before trading.
A bear flag pattern can help crypto traders assess whether a sharp sell-off might continue after a brief consolidation. The pattern provides a framework for planning entries, stop-losses, and profit targets. However, it does not establish a guaranteed trading edge.
This guide explains how to identify a bear flag pattern, evaluate a breakdown, and avoid common trading mistakes.
What is a bear flag pattern?
A bearflag pattern is a bearish continuation pattern, forming after a sharp decline in the price followed by a brief consolidation within roughly parallel trendlines. The channel usually slopes upward against the preceding decline.
A break below the pattern’s lower boundary signals a possible continuation of the downtrend. Bear flags can appear on intraday and daily charts, so their duration depends on the timeframe.
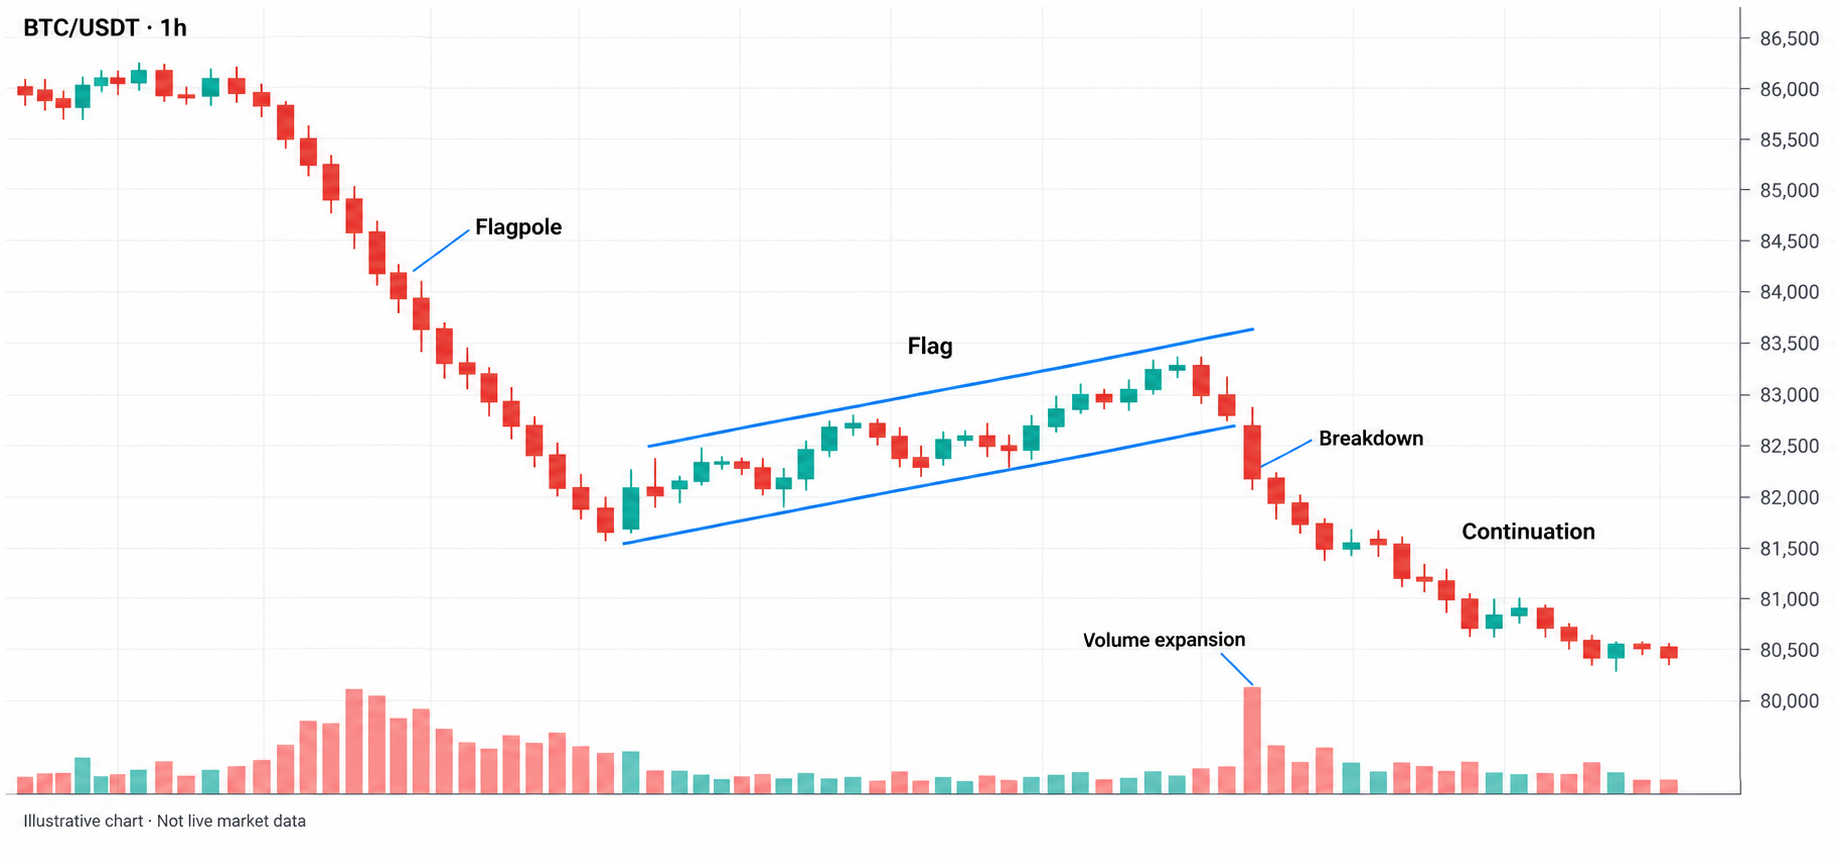
The pattern consists of the following components:
- Flagpole: The flagpole represents the initial sharp decline in the price before the consolidation.
- Flag: After the price declines, a brief consolidation forms, called a flag. It is contained by two roughly parallel trendlines: the upper resistance line and the lower support line. The consolidation reflects a pause in the sell-off, and it does not prove that sellers have regained control.
- Breakdown: It occurs once the price breaks below the support line. A candle closing below support, often with high volume, can support the bearish continuation interpretation. The move can still fail, so entry and invalidation rules should be defined before you enter aposition.
Your $30,000 bonus + 10% discount are waiting on Bybit! Signup and claim these rewards before they’re gone. Time’s ticking!
What a bear flag signals
A bear flag pattern usually carries a bearish continuation bias. Traders watch for a breakdown below flag support as a possible signal that the initial decline is resuming.
However, the crypto market is highly volatile, and false breakdowns can occur due to leverage, trend changes, or low liquidity. Define the entry, invalidation level, and maximum planned loss before opening a position.
Where the bear flag pattern appears
Traders look for a sharp bearish impulse followed by a compact consolidation. A nearby former support level acting as resistance can add context, but it is not required. To assess whether there is enough room for the proposed target, review the broader trend and nearby support.
You can find the pattern appearing on different timeframes, such as 5-minute, 15-minute, hourly, and daily charts. When trading on shorter timeframes, traders should account for the spread, fees, slippage, and brief price fluctuations. Longer timeframes show the setup over a broader interval, but timeframe alone does not establish its probability of success.
Important Read: Leverage Trading in Crypto: How It Works, Risks, and Examples
How to identify a bear flag pattern?
To identify a valid bear flag pattern, consider the following tips:
- On the chart, look for a distinct, sharp price decline that forms the flagpole.
- Identify a brief consolidation within roughly parallel boundaries.
- Compare volume during the decline and consolidation.
- Apply a defined confirmation rule, such as a candle close below the lower boundary.
- Define your entry, stop-loss, profit-target, and position size before placing an order.
Confirmation and what to watch for
To confirm that the bear flag pattern is valid, look for a candle close below the flag support on your chosen timeframe. An intrabar move below support can reverse before the candle closes, so a brief wick below the boundary does not establish a sustained breakdown. Volume can provide supporting evidence: elevated during the initial decline, lighter during consolidation, and expanding on the breakdown.
This volume sequence offers supporting evidence, but does not guarantee further downside. Compare volume within the same exchange and trading instrument, since spot and perpetual futures charts represent different markets.
Some traders wait for a retest of former flag support as resistance. A retest can help define an entry and stop, but price can continue lower without returning to the level. Low liquidity and rapid price reversals can complicate execution.
How to trade a bear flag pattern
The following examples show how traders can structure a bear flag trade. Opening a short position requires a suitable instrument and a predefined risk plan.
For a short position, estimate the downside target by subtracting the flagpole length from the breakdown price. Define the stop-loss using the chosen invalidation rule, then assess the potential reward against the entry-to-stop risk.
A stop-market order might fill beyond its trigger price because of slippage, so the planned loss is an estimate rather than a guaranteed maximum.
All examples below are hypothetical.
Aggressive entry
Suppose Bitcoin (BTC) drops from $55,000 to $52,200, forming a $2,800 flagpole on the 5-minute chart, and it then consolidates. At the planned entry, flag resistance is near $53,200; assume a later breakdown would occur at $52,800.
A trader can anticipate rejection by shorting at $53,100 with a stop-loss at $53,500. If the breakdown happens at $52,800, the measured target is $50,000 ($52,800 - $2,800). This entry occurs before confirmation, and the target remains conditional. Fees and slippage are excluded.
Conservative entry
Suppose Ether (ETH) drops from $2,700 to $2,500, forming a $200 flagpole on a 1-hour chart, and it then consolidates. Instead of opening a position aggressively, you wait for a confirmed close below support.
When the breakdown occurs, the lower boundary is $2,540, and the flag high is $2,620. After a candle closes below $2,540, price retests that level and rejects it. You enter a short position at $2,535 with a stop-loss at $2,630, above the flag high. The measured target is $2,340 ($2,540 - $200).
Your planned risk is $95 per ETH, and the potential reward is $195, approximately 2.05 times the risk before costs.
Important Read: Understanding the Falling Wedge Pattern in Crypto Trading
What invalidates a bear flag pattern?
A candle close above the flag high invalidates the bear flag pattern. A recovery above the flagpole origin fully retraces the initial decline and rules out the original flag interpretation. After a breakdown, reclaiming support can undermine a particular short entry before the entire formation is invalidated.
If the setup fails, follow the exit rule established before entry. Avoid widening the stop-loss simply to keep the trade open. Reassess the broader trend and wait for a fresh setup if the original one no longer holds.
Final thoughts
A bear flag pattern provides a framework for assessing possible bearish continuation after a sharp sell-off. Trading the pattern requires clear identification, a defined entry rule, and controlled trade risk. A breakdown, retest, or measured target does not guarantee a profitable trade.
FAQs
Is a bear flag bullish or bearish?
A bear flag is a bearish continuation pattern, but it can fail and resolve upward.
Does a bear flag need a retest?
A bear flag pattern does not need a retest. A retest is an optional entry method, and price might continue lower without returning to broken support.
What invalidates a bear flag pattern?
Under a flag-high rule, a close above the flag high invalidates the setup. A trade might use a tighter, separately defined stop-loss.
How does a bear flag differ from a bear pennant?
A bear flag pattern has roughly parallel consolidation boundaries, while a bear pennant has converging boundaries.
Sign up on WEEX and roll for a chance to win a share of the $1,000,000 prize pool.