 Price Analysis: Bulls Eye $2.93 Break While Descending Triangle Looms")
Ripple (XRP) Price Analysis: Bulls Eye $2.93 Break While Descending Triangle Looms
XRP is currently trading around the $2.90 mark and appears to be gaining momentum on the micro timeframes. As highlighted in our previous analysis, it is facing resistance at the $3.15 level and has been trading below it for the past few weeks. On the other hand, the support zone near the $2.80 region is holding well, and the price seems to be bouncing off it once again. Let’s take a look at the latest XRP charts to see where the price could be headed in the coming days.
Our XRP Price Prediction Summary
- XRP keeps bouncing off the $2.80 support zone, but momentum hinges on breaking $2.93.
- A clean move above $3.15 is still the real test before any upside conviction.
- The descending triangle keeps downside risk alive if bulls fail to break out soon.
Get started on WEEX with a simple 40 USDT reward. Deposit 100 USDT, make your trade, and claim the bonus.
Analyzing the Charts
Short-Term Breakout Attempt
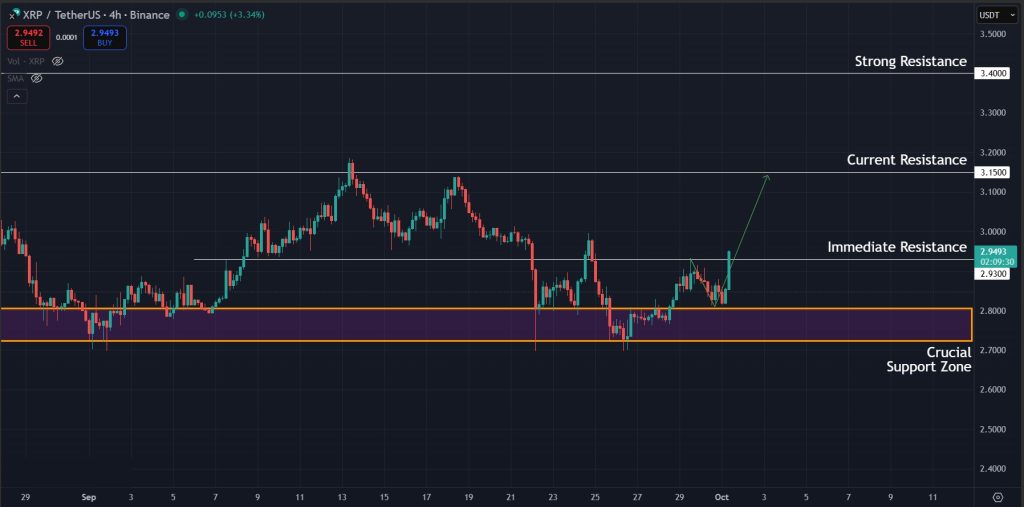
If we look at the latest 4-hour charts for XRP, we can clearly see that the price is trying to break above the immediate resistance at $2.93 and will likely manage to get above it in the coming hours. The support zone under the $2.80 region seems to be holding well once again, and this recent bounce has given the price enough momentum to challenge this short-term resistance. Once the price manages to break above $2.93, the next level to watch for XRP will be the $3.15 mark, where it previously faced resistance.
Daily Timeframe Momentum and Key Levels
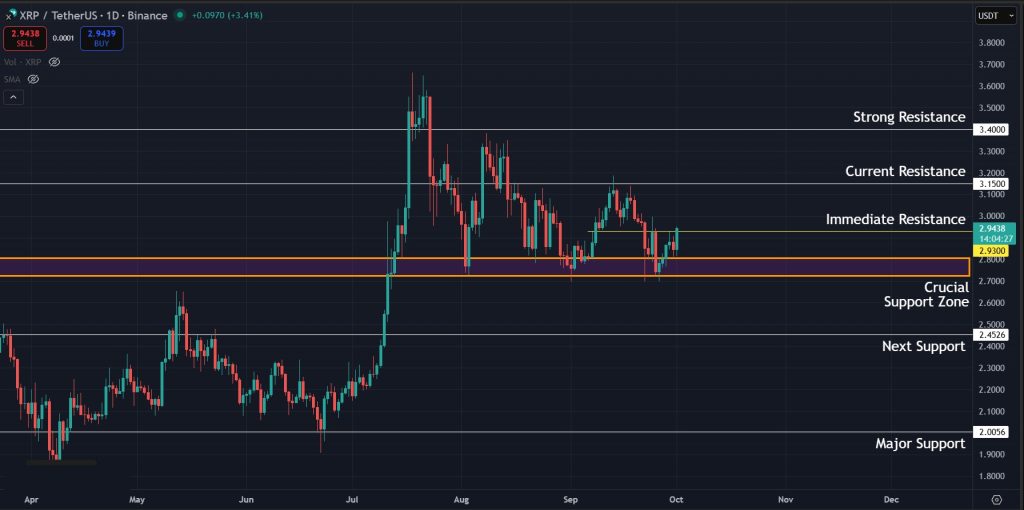
Now, if we switch to the 1-day timeframe, the situation looks similar but becomes clearer. We can see that the support zone below $2.80 has been holding strong since the price broke above it in July. After the most recent retest, the price has gained momentum and is now challenging the immediate resistance at $2.93. It is important for XRP to break above this resistance and push toward $3.15 with conviction. Otherwise, we could see another lower high forming, which would indicate a continuation of the downtrend and put the $2.80 support region at risk.
Trendline Pressure and Triangle Formation
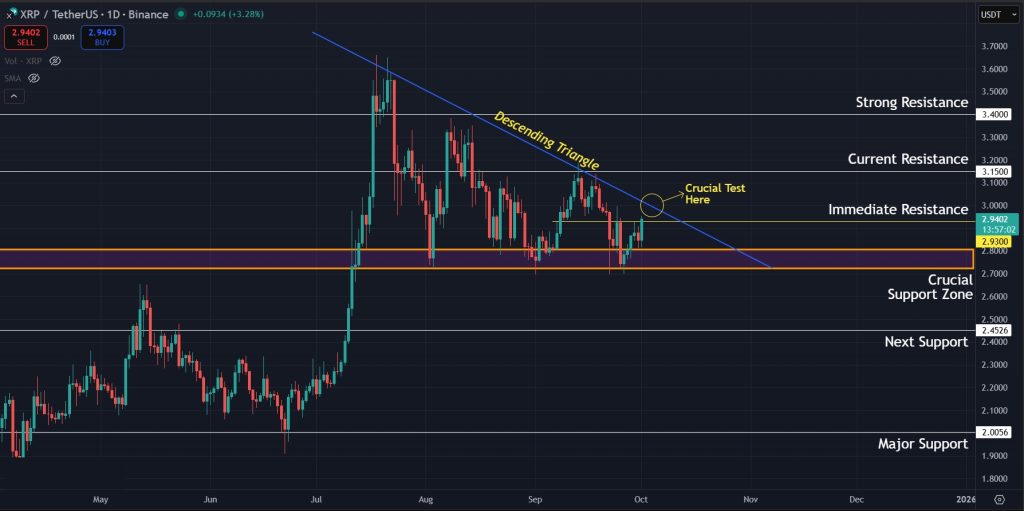
This becomes even more evident if we connect the previous lower highs with a trendline, as the price then forms a descending triangle. A descending triangle is statistically a bearish pattern that usually signals the bulls are losing steam. If the price faces rejection at this trendline once again and drops into the $2.80 support zone, it is likely that bears will try to push below this level, with $2.45 being the next area to watch in that scenario.
Final Takeaway: What is Next for XRP?
XRP is at a decisive point. The $2.80 support has held multiple times and continues to act as a base, while the price is once again testing the $2.93 resistance. A clean break above this level would shift focus back to $3.15, where XRP has struggled before. Until bulls clear that zone with strength, the broader structure still leans cautious, especially with the descending triangle formation on the higher timeframe.
If rejection occurs again, the $2.80 region will be tested, and a breakdown there could open the move toward $2.45. For now, momentum is building on the lower timeframes, but the higher timeframes will determine whether XRP confirms a breakout or continues the downtrend.
Join WEEX and unlock 40 USDT back with your first deposit-and-trade step. Deposit 100 USDT and start trading.
Disclaimer: All content on The Moon Show is for informational and educational purposes only. The opinions expressed do not constitute financial advice or recommendations to buy, sell, or trade cryptocurrencies. Trading involves significant risk and may result in substantial losses. Always seek independent financial advice before making investment decisions. The Moon Show is not responsible for any financial losses or decisions made based on the information provided.
Please view the full disclaimer at: https://themoonshow.com/disclaimer

HYPE Drops Toward $60 As Chip Selloff Hits Crypto
HYPE dropped toward $60 on July 17 as a chip-led selloff pulled risk assets lower. The token fe...

ONDO Surges as DTCC Tokenized Stock Push Brings Wall Street Rails Onchain
ONDO became one of the market’s stronger movers after Ondo launched tokenized stock representat...

Chainlink Tests $8.40 As Mantle’s CCIP Move Puts LINK Back In Focus
Chainlink is getting fresh attention after Mantle moved its $2.5B+ Super Portal from LayerZero ...