 Price Analysis: Relief Bounce at $200 but $215 Still Blocking Momentum")
Solana (SOL) Price Analysis: Relief Bounce at $200 but $215 Still Blocking Momentum
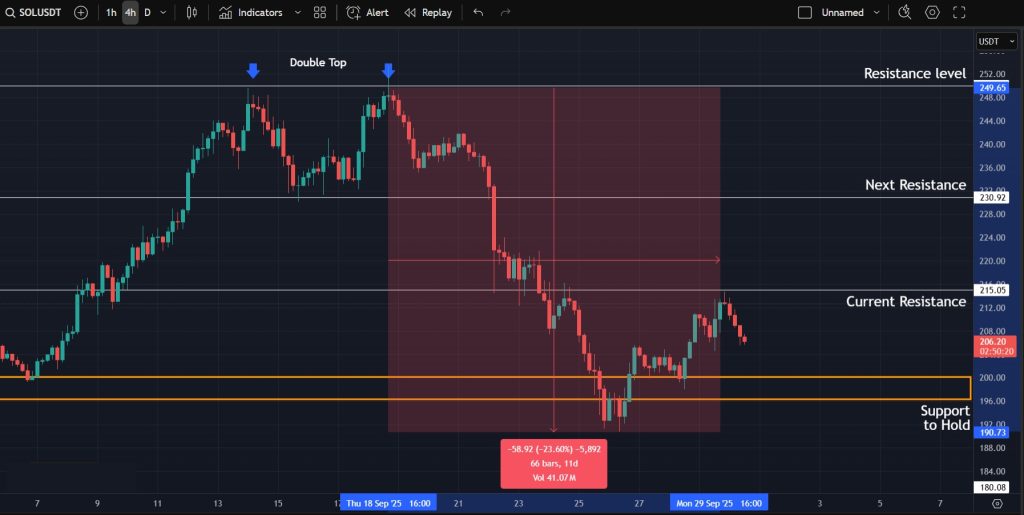
Solana is currently trading around the $205 mark and is trying to gain momentum on lower timeframes. In our previous Solana analysis, we talked about the double-top pattern formed on the 4-hour timeframe that resulted in a big sell-off. As anticipated, the price did go as low as the $200 region but was able to bounce from there after a bit of struggle. This is an important area of support, and SOL needs to stay above it to keep the macro uptrend intact. Let’s take a look at the latest SOL charts to see where the price could be headed next in the coming days.
Our Solana Price Prediction Summary
- Solana held the $200 support after a sharp drop and is now testing $215 again.
- The 4H RSI is oversold, hinting at potential relief if buyers push through $215.
- Losing $200 opens the door to $180, while reclaiming $215 puts $230–$250 back in play.
Get started on WEEX with a simple 40 USDT reward. Deposit 100 USDT, make your trade, and claim the bonus.
Analyzing the Charts
Price Reaction After the $250 Rejection
If we look at the latest 4-hour charts for Solana, we can notice that the price dropped significantly after the double-top rejection at the $250 mark and fell 23.5% last week. This sell-off was also fueled by Bitcoin’s volatility, where Bitcoin also experienced a correction. However, it can now be seen that the price has bounced from the crucial support zone around $200 and is retesting the resistance at $215, facing some pressure there. If SOL manages to stay above the $200 zone and continues further, the trend will remain intact and we will be eyeing the $230 mark.
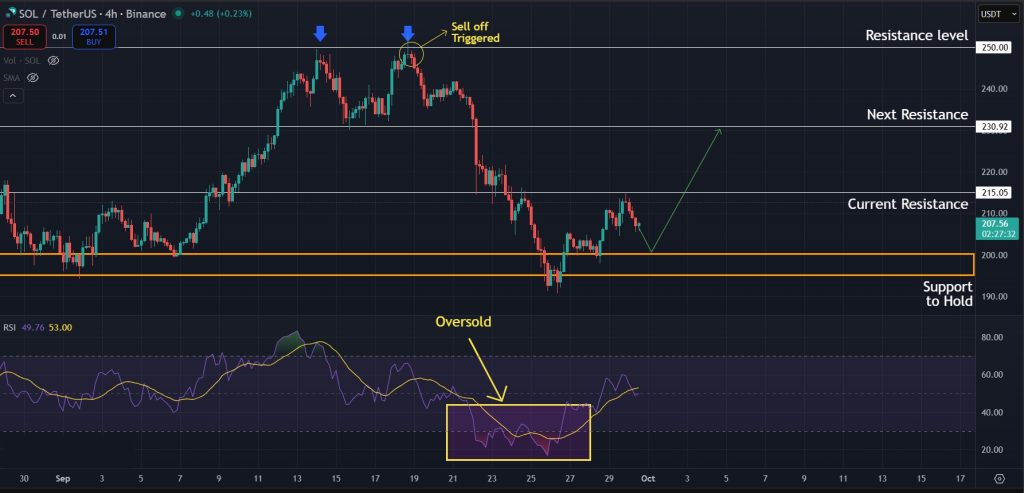
Oversold Signals on the 4H RSI
The 4-hour RSI also shows Solana in oversold territory, which works in favor of the bulls. At the moment, SOL is attempting to break above $215. A clean move through this level could trigger stronger volume and open the way for a retest of $230 in the coming days. Oversold conditions often attract buying interest, and that pattern may play out here as well.
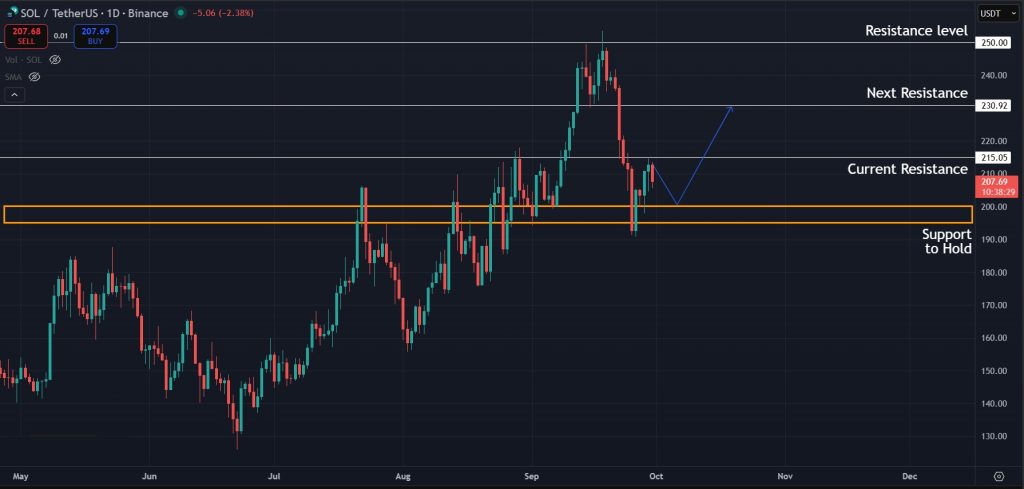
1D Chart Resistance and Targets
Now switching to the 1-day timeframe, we can see a similar picture and how the price bounced from the $200 region. The resistance at $215 is active on this chart as well, and SOL must get above this level to maintain the short-term momentum it gained over the weekend. Once the price breaks above $215, our next target will be the $230 mark, followed by $250, which is the area where the price faced strong rejection last time.
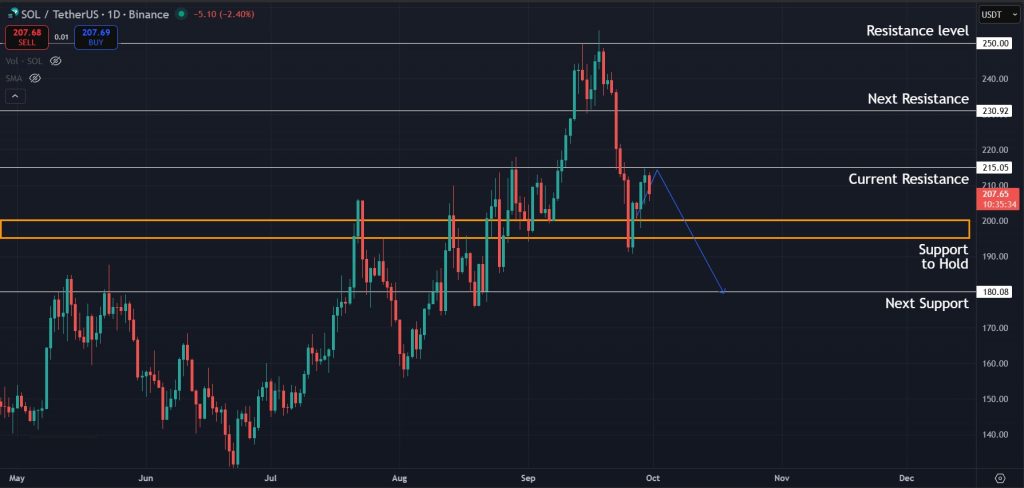
Rejection Scenarios and Pullback Zones
However, as we saw on the 4-hour timeframe, the price has faced rejection at $215 and is heading toward $200 once again. If the bulls fail to hold $200 here, we could see the continuation of this Solana downtrend, and the next level where SOL may find support will be the $180 mark.
Final Takeaway: What is Next for Solana?
Solana is holding a critical zone, and the next move depends on how price reacts around $200 and $215. The recent bounce shows buyers are still active, but the rejection at $215 keeps short-term pressure in play. If bulls defend $200 and break through $215 with momentum, a move toward $230 and possibly $250 becomes likely. The RSI being oversold on lower timeframes also supports the chance of a relief push. But if $200 gives out, the downtrend can extend toward the $180 region. For now, all eyes are on whether SOL can reclaim $215 and keep the broader trend intact.
Join WEEX and unlock 40 USDT back with your first deposit-and-trade step. Deposit 100 USDT and start trading.
Disclaimer: All content on The Moon Show is for informational and educational purposes only. The opinions expressed do not constitute financial advice or recommendations to buy, sell, or trade cryptocurrencies. Trading involves significant risk and may result in substantial losses. Always seek independent financial advice before making investment decisions. The Moon Show is not responsible for any financial losses or decisions made based on the information provided.
Please view the full disclaimer at: https://themoonshow.com/disclaimer

HYPE Drops Toward $60 As Chip Selloff Hits Crypto
HYPE dropped toward $60 on July 17 as a chip-led selloff pulled risk assets lower. The token fe...

ONDO Surges as DTCC Tokenized Stock Push Brings Wall Street Rails Onchain
ONDO became one of the market’s stronger movers after Ondo launched tokenized stock representat...

Chainlink Tests $8.40 As Mantle’s CCIP Move Puts LINK Back In Focus
Chainlink is getting fresh attention after Mantle moved its $2.5B+ Super Portal from LayerZero ...