 Price Analysis: $2.80 Support Crucial as Correction Threatens")
Ripple XRP (XRP) Price Analysis: $2.80 Support Crucial as Correction Threatens
XRP is currently hovering just above the $2.80 mark and is trying to build momentum on the lower timeframes. As highlighted in our previous analysis, the price gained traction after bouncing from the support zone below $2.80 and briefly moved back above $3.00. However, with the larger timeframe showing bearish divergence and Bitcoin dropping at the start of this week, XRP lost momentum again and is now sitting at a crucial support level. Let’s take a quick look at the latest XRP charts to see where the price could be headed in the coming days.
Our XRP Price Prediction Summary
- XRP is holding above the $2.80–$2.70 support zone, but pressure is building.
- A descending triangle on the daily chart and weekly bearish divergence signal downside risk.
- If support breaks, $2.45 and $2.00 are the next major levels to watch.
Get started on WEEX with a simple 40 USDT reward. Deposit 100 USDT, make your trade, and claim the bonus.
Analyzing the XRP Charts
Crucial Support Zone Between $2.80 and $2.70
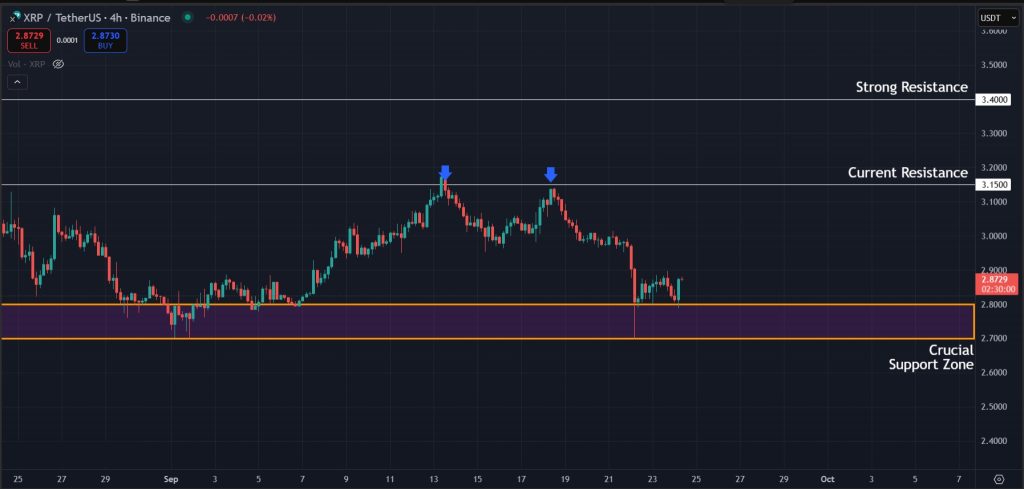
On the latest 4-hour charts for XRP, the price attempted to break above the $3.15 resistance a couple of times recently but failed, resulting in a double top pattern that pushed it back to the $2.80 support zone. The region between $2.80 and $2.70 remains significant, as XRP is holding it well for now, and it is the key support zone that must hold to avoid further sell-off.
Descending Triangle Pattern on Daily Chart
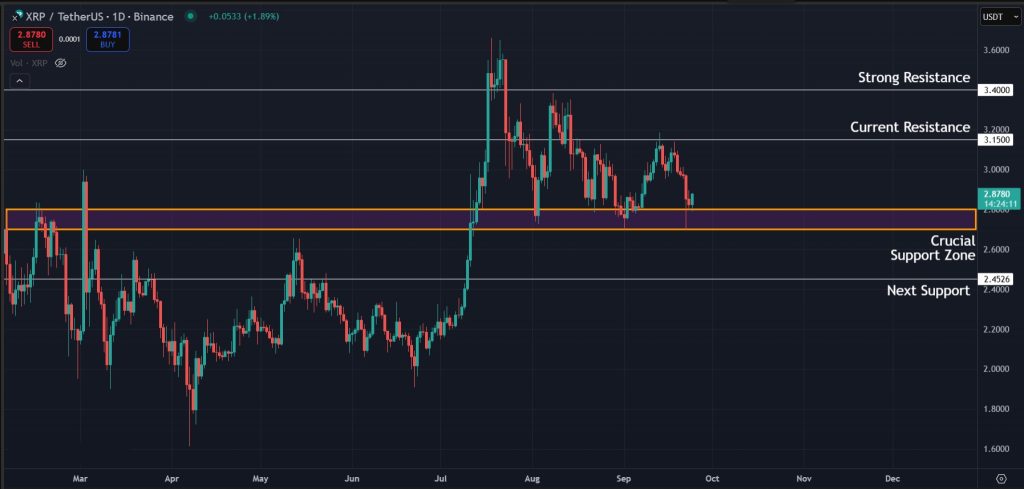
Switching to the 1-day timeframe, the picture looks similar, with the price starting to trend downward here as well. The support zone and resistance level on the daily charts remain the same as mentioned above. However, if the price falls below the $2.80–$2.70 support zone, the next level to watch for XRP will be around $2.45.
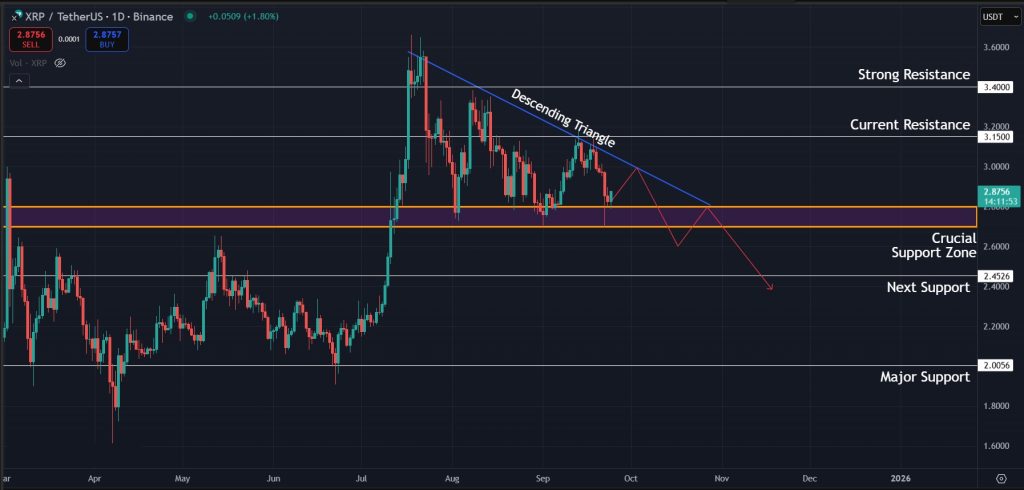
Looking further at the 1-day timeframe, the key detail is that XRP has been forming a series of lower highs while still holding the $2.80 support. This setup is creating a descending triangle pattern, which is typically bearish and often signals a breakdown. If the price rejects the upper boundary of this structure again, the next move could trigger a breakdown toward the $2.45 support level. However, if selling pressure increases (which looks likely at the moment) the $2.00 level could also come into play during this correction.
Bearish Divergence on the Weekly Timeframe
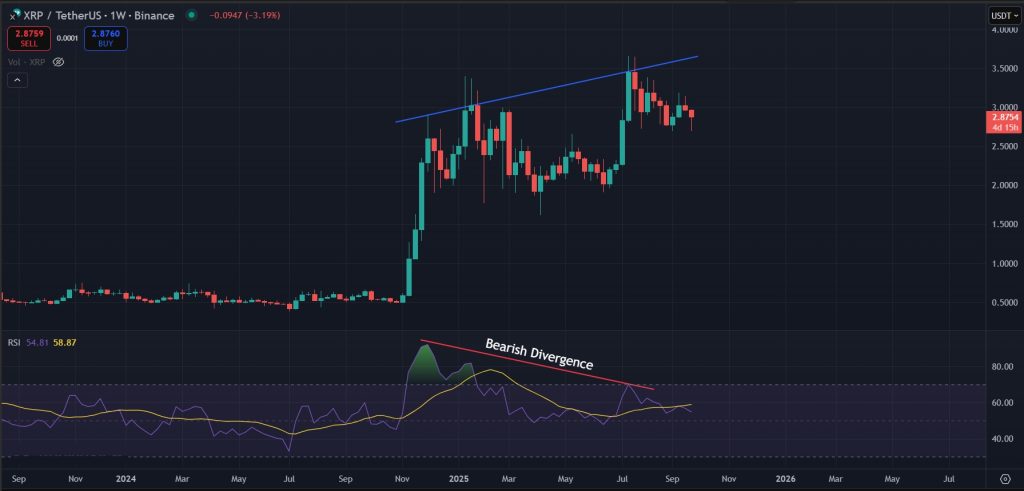
Lastly, we cannot ignore the massive bearish divergence on the 1-week timeframe, which is the main reason our XRP price prediction is leaning bearish at the moment. The price is forming higher high while the RSI is forming lower high. This bearish divergence is still in play, keeping the door open for a bigger correction in the coming weeks.
Final Takeaway: What is Next for XRP?
XRP is holding above the $2.80–$2.70 support zone for now, but the charts continue to show signs of weakness. The 4-hour and daily timeframes point to a descending structure, while the weekly bearish divergence reinforces the risk of a deeper correction. If the $2.80–$2.70 support fails, the next levels to watch are $2.45 and $2.00. For XRP to shift momentum back to the upside, it would need to reclaim resistance levels above $3.15 with strength. Until then, the indicators suggest caution, as the bias remains tilted toward further downside pressure.
Start trading on WEEX with a 100 USDT deposit and unlock 40 USDT back after completing your first trading step.
Disclaimer: All content on The Moon Show is for informational and educational purposes only. The opinions expressed do not constitute financial advice or recommendations to buy, sell, or trade cryptocurrencies. Trading involves significant risk and may result in substantial losses. Always seek independent financial advice before making investment decisions. The Moon Show is not responsible for any financial losses or decisions made based on the information provided.
Please view the full disclaimer at: https://themoonshow.com/disclaimer

HYPE Drops Toward $60 As Chip Selloff Hits Crypto
HYPE dropped toward $60 on July 17 as a chip-led selloff pulled risk assets lower. The token fe...

ONDO Surges as DTCC Tokenized Stock Push Brings Wall Street Rails Onchain
ONDO became one of the market’s stronger movers after Ondo launched tokenized stock representat...

Chainlink Tests $8.40 As Mantle’s CCIP Move Puts LINK Back In Focus
Chainlink is getting fresh attention after Mantle moved its $2.5B+ Super Portal from LayerZero ...