 Price Analysis: Short-Term Strength Builds While Daily Trend Lags")
Ethereum (ETH) Price Analysis: Short-Term Strength Builds While Daily Trend Lags
Ethereum is trading around $4,300 and is starting to show signs of renewed strength on the lower timeframes. As highlighted in our previous analysis, ETH was expected to retest the $3,900 support zone, and the price did exactly that before bouncing and reclaiming $4,000 without much resistance. The recent recovery has shifted short-term sentiment, and the price is now eyeing higher levels on the micro timeframes. With that in mind, it’s worth examining the latest charts to get a clearer idea of where Ethereum could be headed next. Let’s take a look:
Our Ethereum Price Prediction Summary
- ETH needs a confirmed break above $4,250 before any real attempt at $4,500.
- The broader trend is still bearish despite short-term strength on lower timeframes.
- A pullback to $3,800 or even $3,500 is still in play if a correction triggers.
Get started on WEEX with a simple 40 USDT reward. Deposit 100 USDT, make your trade, and claim the bonus.
Analyzing the Ethereum Charts
Strength Building on the 4H Chart
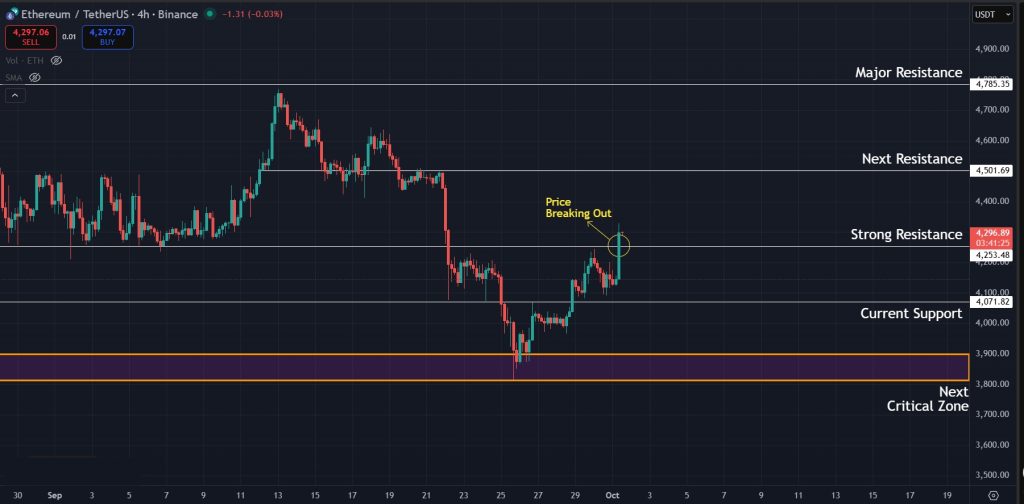
On the latest 4-hour chart, Ethereum has shown a strong rebound from the $3,800 support region. After recovering that level, the price pushed through $4,000 and has now moved above the $4,250 resistance level. This shift signals improving structure, but for the move to hold, ETH still needs to secure multiple candle closes above this area and see it retested as support. If the momentum sustains, the $4,500 level becomes the next upside target.
Daily Timeframe and Key Resistance Test
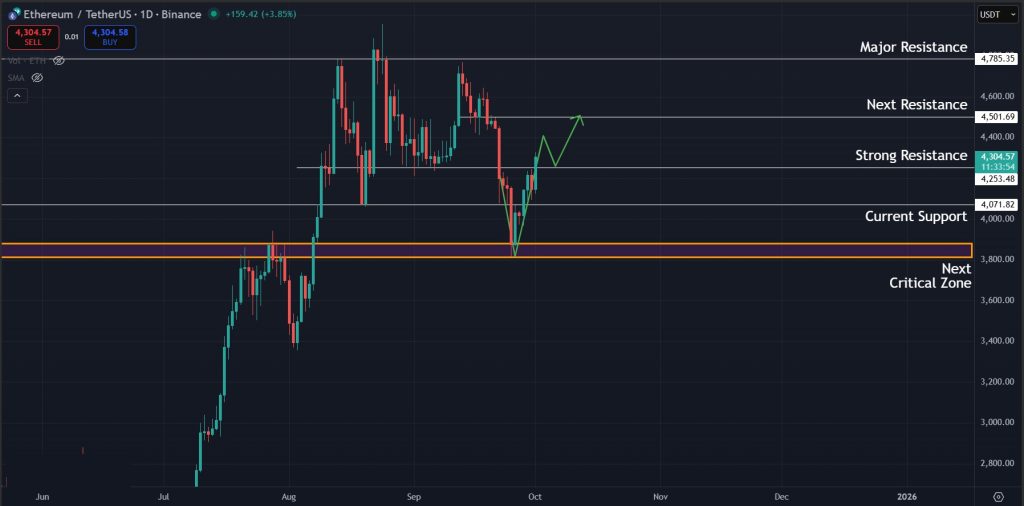
On the 1-day timeframe, the setup looks similar, with the price attempting to break above the $4,250 resistance. A daily close above this level would increase the likelihood of a move toward $4,500 in the short term. That area is a strong resistance zone, and if momentum carries forward, the bulls will find it difficult to clear it on the first attempt.
Trend Pressure and Key Moving Average
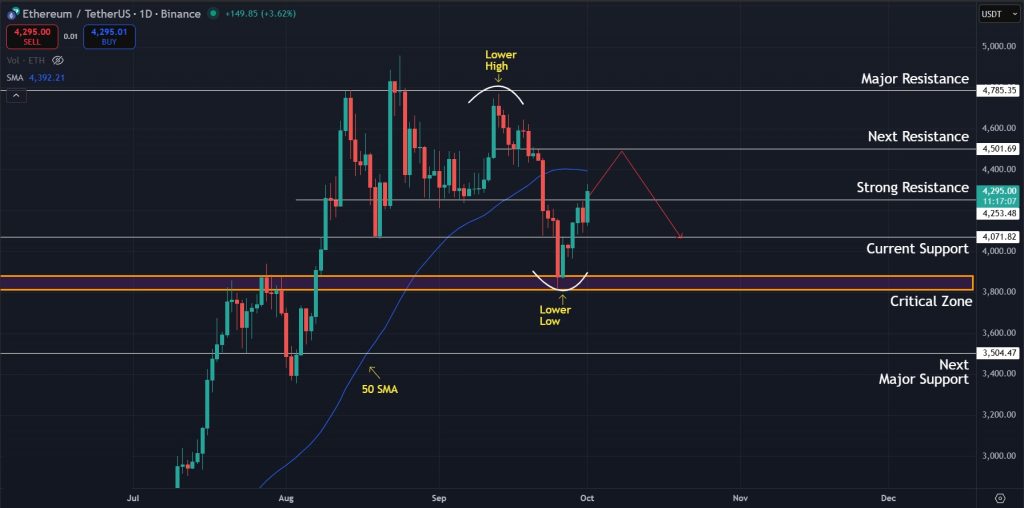
With short-term momentum leaning bullish, our Ethereum price prediction also currently leans to the upside. Even so, the 50-day SMA (simple moving average) on the daily chart needs attention, as ETH recently lost it as support and it may act as resistance in the near term. The broader daily structure is still in a downtrend, with the price forming a lower high and a lower low. This setup suggests Ethereum could face difficulty breaking above $4,500, and a retest of the $3,800 zone remains possible. If that support fails to hold, the next area to watch would be the $3,500 major support level.
Final Takeaway: What is Next for Ethereum?
In the short term, momentum is tilted in favor of the bulls. However, Ethereum still needs confirmation from key levels before any sustained move higher can take shape. Lower timeframes show improving strength, yet the broader daily structure hasn’t fully shifted bullish. If buyers manage to hold above support and secure a clean move past the next resistance, a push toward $4,500 becomes more likely. However, failure to maintain current levels could trigger another retest of the $3,800 , with $3,500 also coming into play. For now, the indicators point to cautious optimism, but Ethereum still has to prove its strength before a clear breakout can be confirmed.
Join WEEX and unlock 40 USDT back with your first deposit-and-trade step. Deposit 100 USDT and start trading.
Disclaimer: All content on The Moon Show is for informational and educational purposes only. The opinions expressed do not constitute financial advice or recommendations to buy, sell, or trade cryptocurrencies. Trading involves significant risk and may result in substantial losses. Always seek independent financial advice before making investment decisions. The Moon Show is not responsible for any financial losses or decisions made based on the information provided.
Please view the full disclaimer at: https://themoonshow.com/disclaimer

HYPE Drops Toward $60 As Chip Selloff Hits Crypto
HYPE dropped toward $60 on July 17 as a chip-led selloff pulled risk assets lower. The token fe...

ONDO Surges as DTCC Tokenized Stock Push Brings Wall Street Rails Onchain
ONDO became one of the market’s stronger movers after Ondo launched tokenized stock representat...

Chainlink Tests $8.40 As Mantle’s CCIP Move Puts LINK Back In Focus
Chainlink is getting fresh attention after Mantle moved its $2.5B+ Super Portal from LayerZero ...