
HYPE Drops Toward $60 As Chip Selloff Hits Crypto
HYPE dropped toward $60 on July 17 as a chip-led selloff pulled risk assets lower. The token fell harder than Bitcoin, Ethereum and Solana, which shows how quickly traders moved out of faster-moving altcoins once sentiment turned. Hyperliquid still has a wider market story after T. Rowe Price listed it inside the eligible universe for its new active multi-token crypto ETF. That keeps HYPE visible, but the daily chart now has to hold the $60 area. A daily close below $60 would shift attention toward $58 and $55, while a recovery above $64 would show that buyers are trying to repair the drop.
Key Takeaways
- HYPE fell around 10% as weakness in semiconductor stocks spread into crypto.
- The token dropped harder than Bitcoin, Ethereum and Solana during the selloff.
- T. Rowe Price’s new active multi-token crypto ETF includes Hyperliquid in its eligible universe.
- The daily chart is now testing the $60 area.
- A close above $64 would help the chart stabilize, while a close below $58 would weaken the setup.
Chip-Led Selling Pulls HYPE Back Toward $60
HYPE was one of the sharper losers on July 17 as selling moved from semiconductor stocks into crypto.
A CoinDesk market update showed HYPE falling around 10% to the $60 area. Bitcoin was down about 2%, Ethereum lost around 4%, and Solana slipped about 2%.
The pressure started in Asian chip stocks as Japan’s Nikkei 225 had its worst session since March, while Taiwan Semiconductor and other chip names also came under pressure. Crypto followed as traders reduced risk across assets that had already rallied hard.
HYPE was more exposed to that move because it had been one of the stronger altcoins in recent weeks. When the market turns defensive, those names often face the fastest selling.
The drop now puts HYPE back at an important daily level. The token does not need to recover the full move immediately, but it does need buyers to show up around $60. A weak close below that area would make the pullback look heavier.
T. Rowe Price ETF Keeps Hyperliquid on The Institutional Radar
The selloff came one day after T. Rowe Price launched its active multi-token crypto exchange-traded product.
The product is not a Hyperliquid ETF, so it should not be treated like a direct HYPE fund. The relevant point is the asset list. T. Rowe Price said the fund can invest in leading crypto assets from an eligible universe that includes Bitcoin, Ethereum, Binance, XRP, Solana, Hyperliquid and others.
That places Hyperliquid inside a more serious institutional basket. It also helps explain why HYPE remains worth tracking even after a sharp daily drop.
The ETF angle is not enough to stop a risk-off selloff. Price still has to confirm support. But it does keep Hyperliquid in a stronger conversation than a normal speculative token falling with the market.
For now, the news backdrop and the chart are moving in different directions. Hyperliquid has gained visibility, while HYPE is testing whether the recent rally still has support.
HYPE Daily Chart Shows $60 As The Main Test
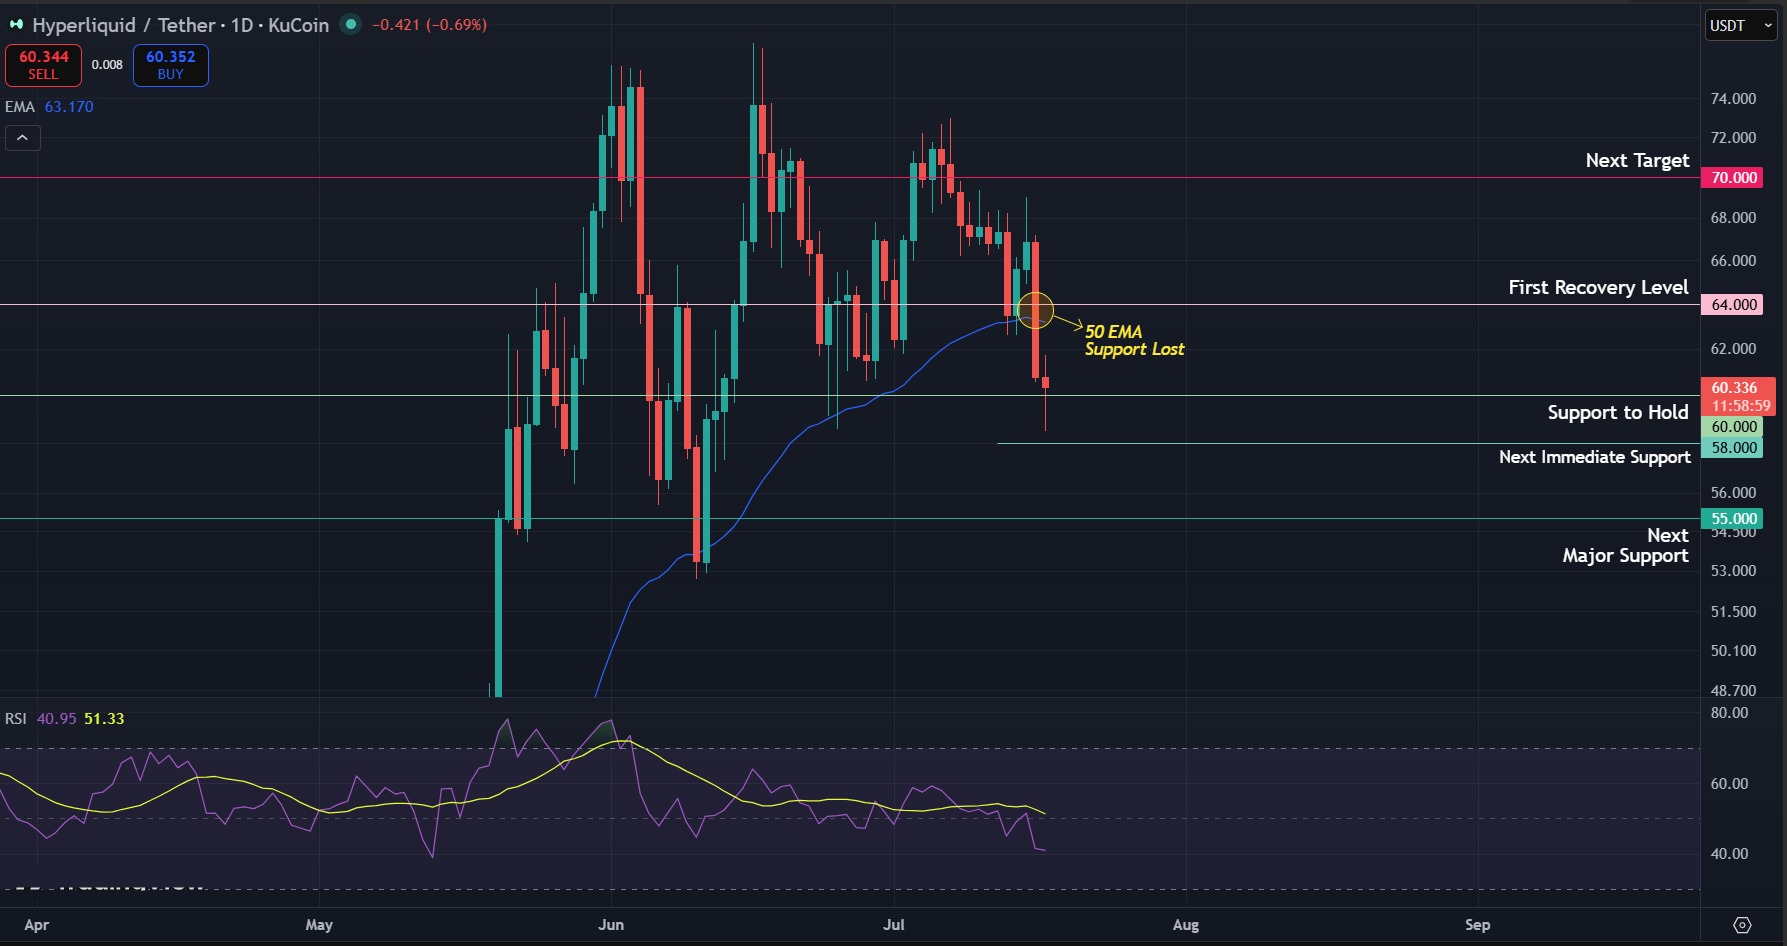
The daily chart gives a cleaner view of the current move compared to micro timeframes. HYPE has not only dipped after one bad candle. It has pulled back into the area that now decides whether the recent rally stays intact or starts turning into a deeper correction.
The first level to watch is $60. HYPE is trading around this area, and the daily close matters more than a quick intraday wick. If buyers keep the price above $60 by the close, the pullback can still look controlled.
A close below $60 would put pressure on the chart. The next level is $58, which becomes the first breakdown test if sellers keep control. Losing $58 would show that buyers failed to defend the main support area after the selloff.
Below $58, the next important level is $55. This is the level where the drop would start to look more serious on the daily chart. A move into $55 would bring HYPE closer to a deeper reset instead of a normal pullback.
On the upside, $64 is the first recovery level. HYPE needs a daily close back above $64 before the chart starts to look stable again. A bounce that fails below $64 would not be enough because sellers would still be controlling the lower high.
Above $64, the next resistance is $70. This is where HYPE would need stronger follow-through. A daily close above $70 would show that buyers have absorbed the selloff and are trying to move the token back into its previous range. A successful flip of this level will bring HYPE out of the repair mode.
The daily RSI also supports a more cautious read. Momentum has cooled with the drop, but that alone is not a buy signal. The better sign would be RSI flattening while HYPE holds $60, or turning higher while price reclaims $64. If RSI keeps falling and price loses $58, the pullback would look much weaker.
Another important thing to note on the daily chart is the loss of the 50 EMA support. The price was holding above it for a while now keeping HYPE’s momentum intact for the past few months. Bulls would flip this over again to avoid losing momentum and any further sell-off.
For now, HYPE is sitting at the level buyers need to defend. A daily close above $60 keeps the setup alive. A close below $58 would shift control toward sellers.
What to Expect Next
- Bullish case: HYPE holds $60 on the daily chart and closes back above $64. A move above $67 would bring $70 back into focus.
- Bearish case: HYPE closes below $60 and fails to recover quickly. That would put $58 in focus, followed by $55 if selling continues.
- Key catalyst: The chip-led risk-off move is driving the short-term price action. T. Rowe Price’s active crypto ETF launch keeps Hyperliquid visible, but the daily chart still needs support.
- Invalidation: A daily close below $55 would damage the short-term setup. A clean daily close above $70 would give buyers a stronger recovery signal.
Get started on WEEX with a simple 40 USDT reward. Deposit 100 USDT, make your trade, and claim the bonus
Why is HYPE down today?
HYPE is down because selling pressure moved from semiconductor stocks into crypto. The token fell harder than Bitcoin and Ethereum because it has been trading like a faster-moving altcoin.
How much did HYPE fall?
Market data showed HYPE falling around 10% on July 17, with price moving back toward the $60 area.
Why is T. Rowe Price relevant to Hyperliquid?
- Rowe Price launched an active multi-token crypto exchange-traded product and included Hyperliquid in the eligible universe. That gives HYPE more institutional visibility, although today’s price action is still being driven by market selling.
What HYPE price level matters most now?
The main level is $60 on the daily chart. If HYPE holds this area, buyers can try to recover $64. If $60 fails, $58 becomes the next support.
Can HYPE recover toward $70?
HYPE can recover toward $70 if buyers hold $60, reclaim $64 and then close above the $67 resistance area.
Is HYPE oversold now?
The daily RSI has cooled after the drop, but price still needs confirmation. A move back above $64 would show better recovery strength. A daily close below $58 would keep sellers in control.
Disclaimer: All content on The Moon Show is for informational and educational purposes only. The opinions expressed do not constitute financial advice or recommendations to buy, sell, or trade cryptocurrencies. Trading involves significant risk and may result in substantial losses. Always seek independent financial advice before making investment decisions. The Moon Show is not responsible for any financial losses or decisions made based on the information provided.
Please view the full disclaimer at: https://themoonshow.com/disclaimer

Bitcoin and Ethereum Quarterly Returns 2026: Q1-Q3 Trends and Q4 Outlook
Quarterly returns for Bitcoin (BTC) and Ethereum (ETH) offer a simple way to measure how the tw...

LINK Breaks August High as Chainlink Expands Into Global Payments
LINK is holding above $13 on September 7 after gaining 9.9% in the previous session. The move c...

XRP ETF Inflow Streak Ends After $170M Run. Can Price Hold $1.31?
XRP is trading near $1.36 on September 3 after U.S. spot XRP ETFs recorded their first net outf...