



Quick Summary: A triple bottom pattern suggests a possible recovery after a downtrend. Price tests a similar support zone three times, but the setup remains incomplete until price closes above neckline resistance. This guide explains confirmation, entries, targets, and risk using a hypothetical Ethereum trade.
What is a triple bottom pattern?
A triple bottom is a potential bullish reversal pattern that forms when the price rebounds three times from a similar support zone after a decline. Two rallies separate the lows and establish resistance, called the neckline.
The pattern signals that a prolonged downtrend is losing momentum and the control is shifting from sellers to buyers.
Until resistance breaks, the price may remain in a range or resume falling.
Your $30,000 bonus + 10% discount are waiting on Bybit! Sign up and claim these rewards before they’re gone. Time’s ticking!
How to identify and confirm the pattern?
To identify and confirm a triple bottom pattern, follow these steps:
- Find an existing downtrend. Without a preceding decline, three lows may simply be part of a trading range.
- Identify three separate lows near the same support zone, with meaningful rebounds between them.
- Mark resistance near the two intervening rally highs. If they differ, use the higher one as the breakout threshold.
- Wait for a candle to close above that resistance on the timeframe you are analyzing. A brief wick above it is insufficient.
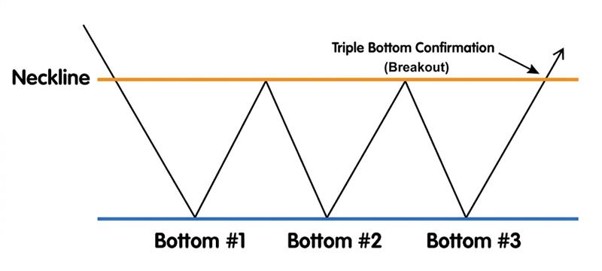
Holding support suggests buyers are defending that area; it does not confirm a trend reversal. Also, three support tests don’t automatically make a triple bottom more reliable than a double bottom.
Volume and timeframes
Volume may decline during the pattern formation and expand during the breakout. Increased participation supports the signal, but volume cannot guarantee success.
Compare the breakout candle’s trading volume with the volume of the recent candle on the same chart. Remember, crypto volume differs by exchange and trading pair, and one venue does not represent the entire market.
How long the pattern takes to form depends on the chart timeframe. Three distinct swings can develop over many candles; three neighboring candles alone are insufficient.
Use the same timeframe to identify the pattern and assess its breakout.
Important Read: Triple top pattern in crypto and how to trade it
Key terms explained
How to trade a triple bottom pattern?
Trading a triple bottom requires a clear understanding of the pattern. You should know where to enter a trade, how to calculate the target, and where to place the stop-loss.
You can trade a triple bottom in the following ways:
- Breakout entry: Consider opening a long position after the breakout candle closes above resistance. Do not chase a move far above the neckline. For stop-loss, place it below a relevant swing low to allow for normal price movement. A wider stop below the pattern’s support requires a smaller position if you keep the same planned cash risk.
- Retest entry: Wait for the price to revisit the neckline and close back above it, suggesting resistance is becoming support. Place a stop-loss below the retest low. Remember, retests do not always occur, and this entry can still lose money.
Price target and Ethereum example
Estimate the target by adding the pattern height to neckline resistance.
Suppose Ethereum (ETH) forms three lows near $2,250, with neckline resistance at $2,400. The pattern height is $150. Adding this to the neckline gives an estimated target of $2,550. This is a hypothetical example.
- Entry: $2,410 after a confirmed retest
- Stop-loss: $2,340, assuming it lies below the retest low
- Potential loss per ETH: $2,410 - $2,340 = $70
- Potential gain per ETH: $2,550 - $2,410 = $140
The reward-to-risk ratio is 2:1 before costs. Earlier resistance may justify taking profit before the measured target.
Risk and position size
Before entering, choose how much money you plan to risk on the trade. Divide that amount by the difference between your entry and stop-loss prices. With a $1,000 account, a chosen $10 risk budget, and a $70 stop distance, the position is about 0.14 ETH before costs. Allow for fees and slippage when sizing the position.
Stop-market orders can fill beyond their trigger price, so the final loss may exceed the initial estimate. Don’t widen your stop just to avoid taking a loss.
Important Read: Understanding the ascending triangle pattern in crypto trading
When the pattern fails
Before confirmation, a sustained break below the support zone invalidates a triple bottom pattern. A brief wick below the support zone does not automatically invalidate it. After a breakout, a sustained move back below the neckline can signal a failed breakout.
A retest trade can hit your stop-loss even if the broader pattern stays valid, because a temporary wick can trigger an exit. Stick to your risk plan and re-evaluate price action before re-entering.
Final thoughts
You can use a triple bottom pattern to spot a possible recovery after a downtrend. Once the price closes above the neckline, check your entry, stop-loss, and target to see whether the trade is worth taking.
If the potential reward is too small for the risk involved, wait for another setup. Even a clear breakout can fail, so keep your position size manageable and follow the exit plan you set before entering.
FAQs
What confirms a triple bottom pattern?
A candle close above neckline resistance after the third low confirms the triple bottom pattern. However, it does not guarantee that price will keep rising.
How does a triple bottom differ from a double bottom?
A double bottom pattern has two lows; a triple bottom has three. Both need a resistance breakout, and neither is automatically more reliable.
Should all three lows in a triple bottom pattern be identical?
No. They should cluster around a similar support zone. A sustained break below that zone weakens the setup.
How do you calculate the target when trading a triple bottom?
Calculate the target by subtracting support from the neckline, then adding that distance back to the neckline. Use the result as an estimate.
How reliable is a triple bottom pattern?
No single success rate applies to every crypto market and timeframe. Test your entry and exit rules against past price data, including trading costs, before using the setup.
Sign up on WEEX and roll for a chance to win a share of the $1,000,000 prize pool.