


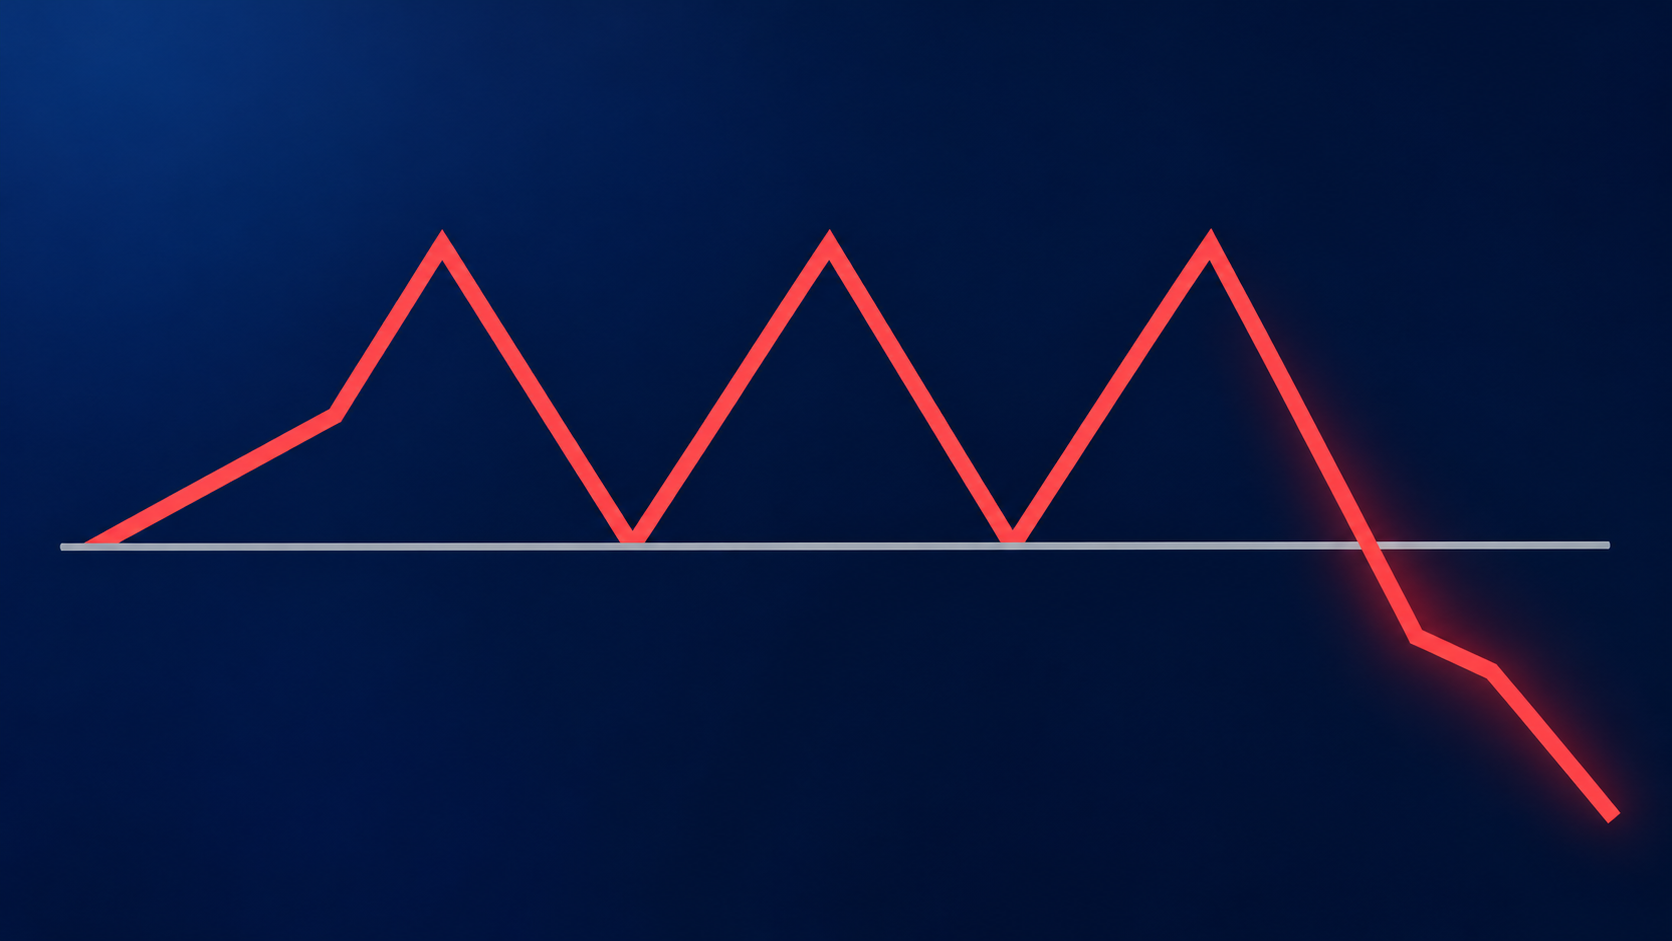
Quick Summary: A triple top pattern forms when the price tests a similar resistance zone three times after an uptrend. Traders watch for a close below the support between the peaks, then treat it as a bearish reversal setup. The pattern’s confirmation doesn’t guarantee a decline, so plan your entry, stop-loss, and position size first.
What is a triple top pattern?
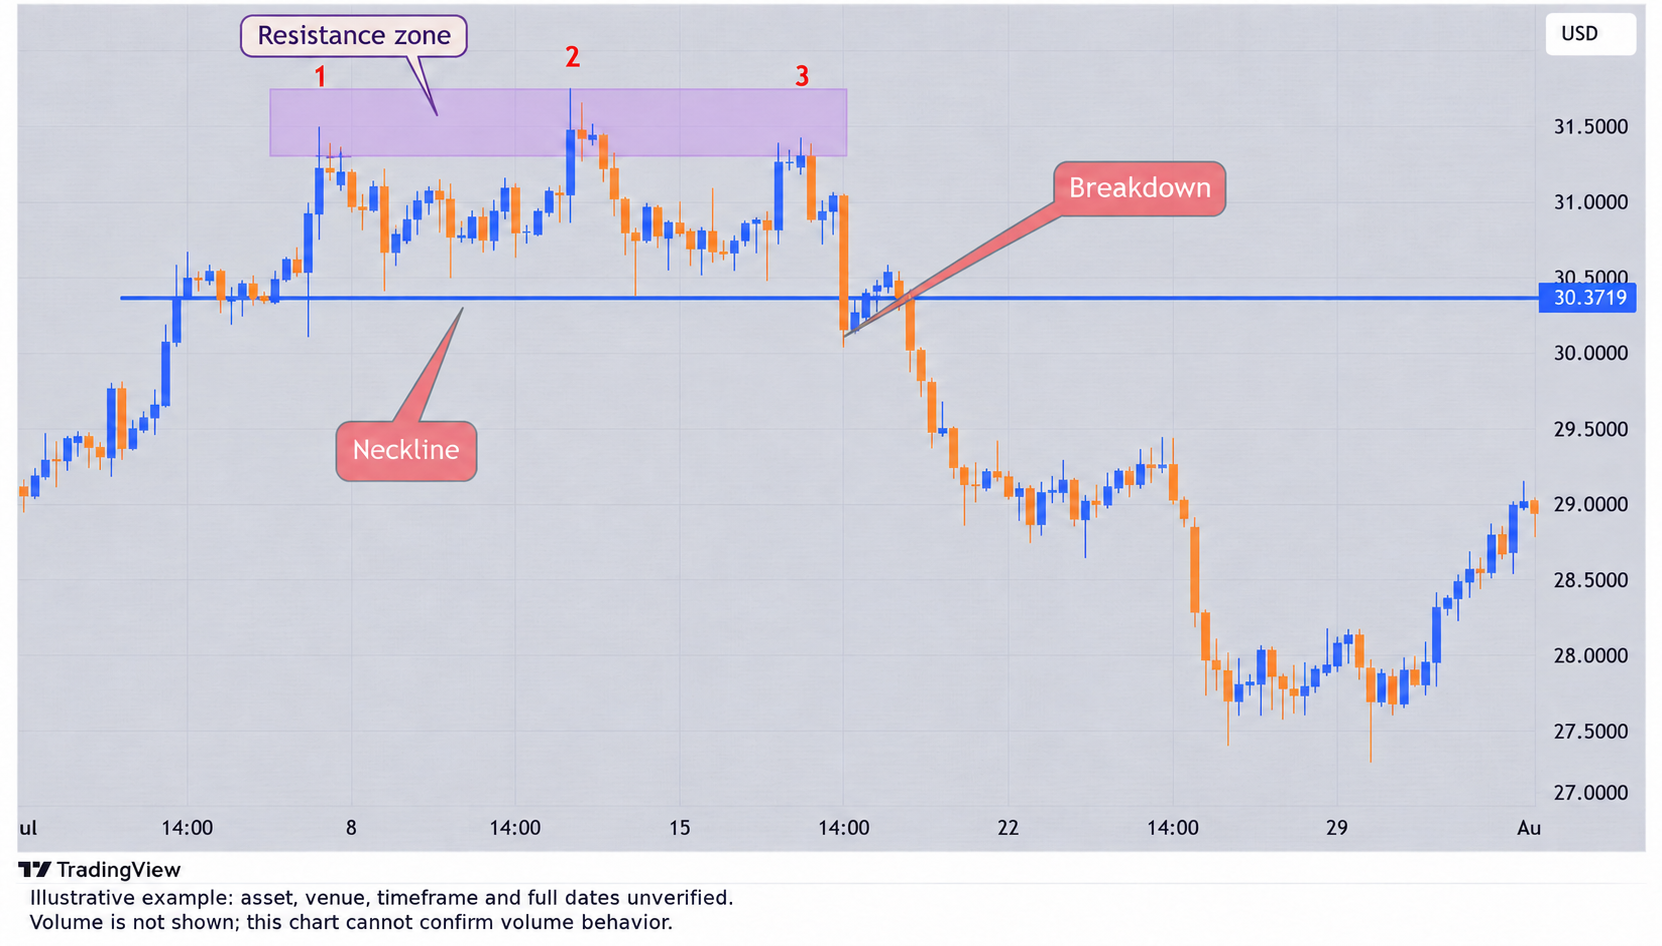
A triple top is a potential bearish reversal pattern that develops after an uptrend. It has three separate peaks near the same resistance zone, with two pullbacks between them.
The neckline marks support around those pullback lows. A candle closing below the neckline after the third peak confirms the pattern.
The pattern signals that buyers are losing strength and sellers are gaining control.
Here is how this transition unfolds:
- Uptrend end: The market enters the pattern in a clear uptrend, making higher highs. However, hitting the same resistance level three times without breaking through proves the buyers’ upward momentum has ended.
- Bearish reversal start: Once the price breaks down through the support level (the neckline) connecting the intermittent lows, the uptrend officially reverses into a bearish markdown phase..
Until support breaks, the price may continue moving sideways or rise above resistance.
Your $30,000 bonus + 10% discount are waiting on Bybit! Sign up and claim these rewards before they’re gone. Time’s ticking!
How to identify a triple top pattern
When identifying a triple top pattern, look for:
- An existing uptrend before the formation.
- Three distinct peaks near the same resistance zone.
- A neckline formed by two pullbacks between the peaks.
- A candle close below the neckline after the third peak.
The peaks do not need to match exactly. Avoid treating three nearby candles within one small price swing as three separate tops.
Where to look for the triple top
Look for an established uptrend, especially near an area where the price previously struggled to rise. Three peaks inside a sideways range do not establish an uptrend reversal.
Match confirmation to your chart’s timeframe: use a one-hour close for a one-hour setup and a daily close for a daily setup.
Remember, no timeframe guarantees success.
Important Read: Head and shoulders pattern: crypto trading rules and risks
What does a triple top signal?
A triple top pattern usually marks the end of an uptrend and the start of a bearish reversal. Buyers lose momentum after three failed attempts to break higher, and sellers take control.
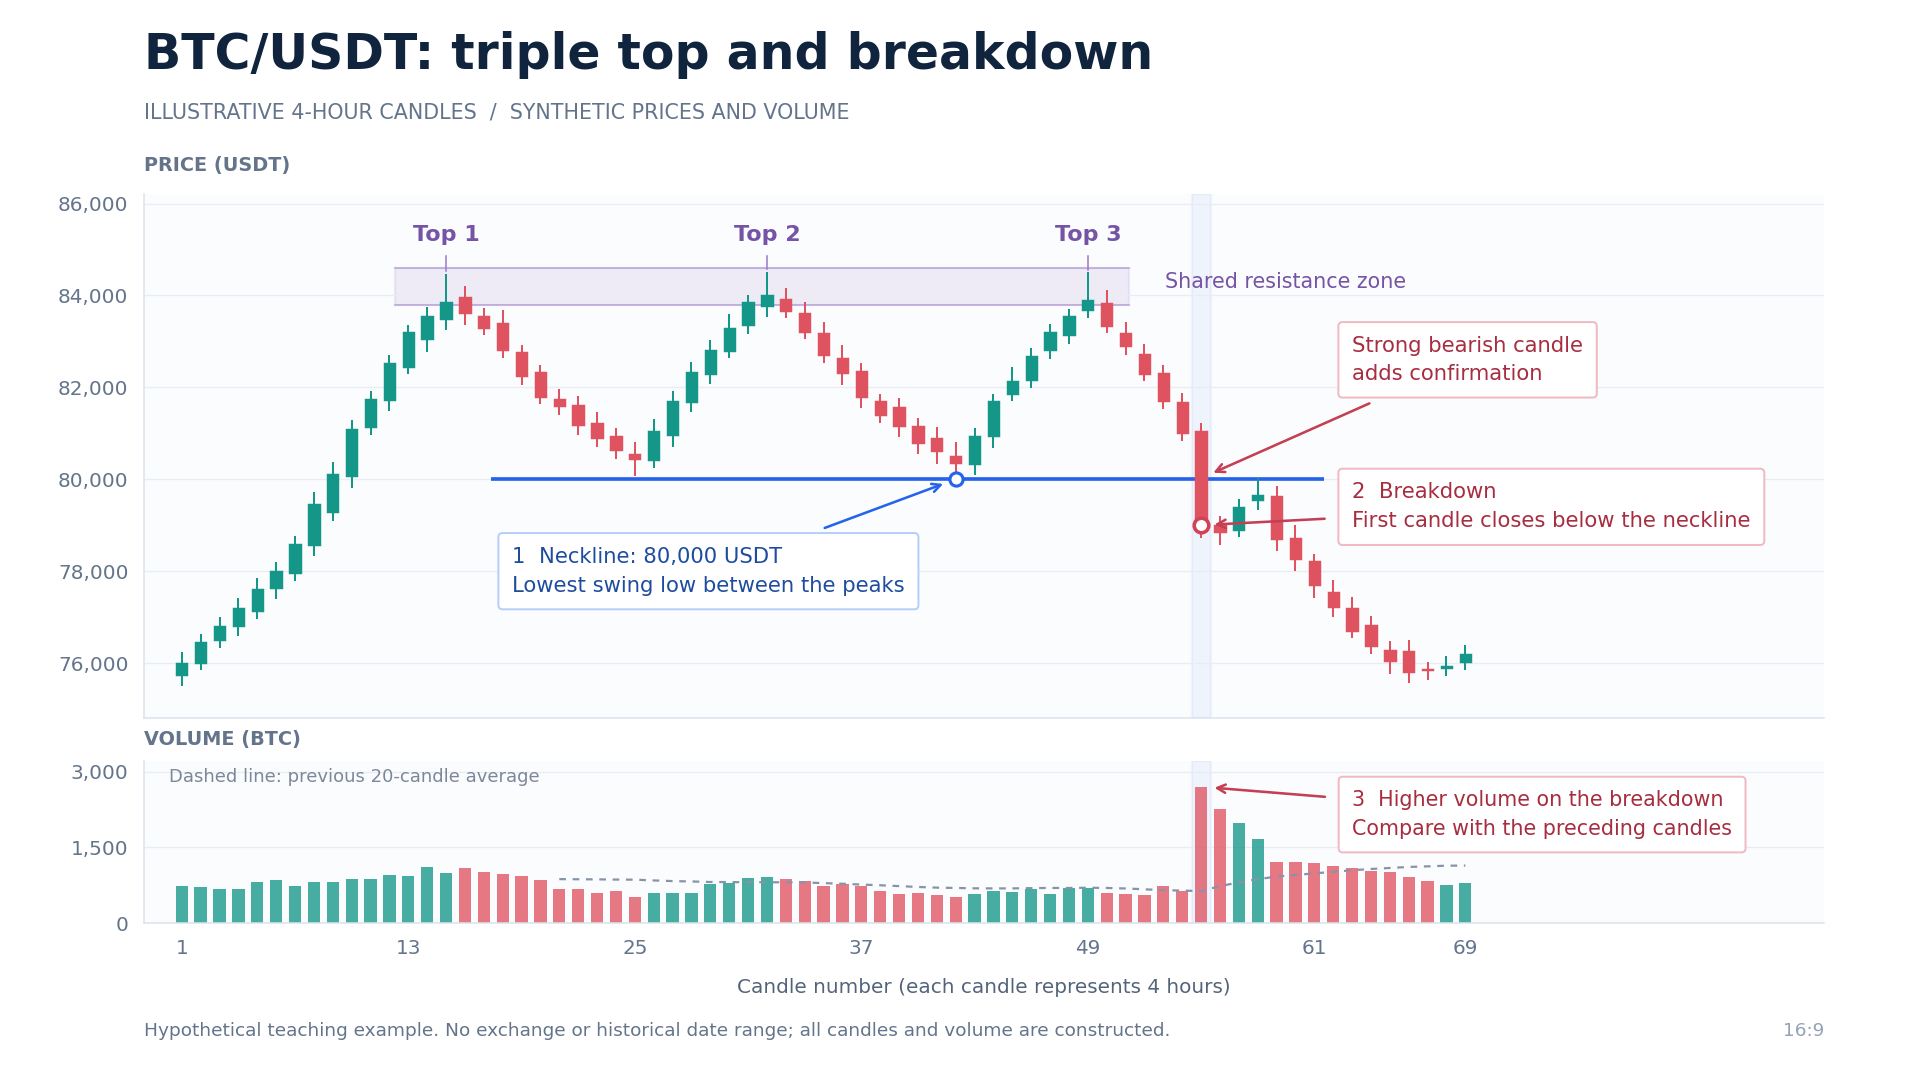
The neckline is the key level to watch that is drawn across the lowest point between the three highs.
To confirm the breakdown:
- Draw a horizontal line through the lowest swing point between the peaks.
- Wait for a candle to close below the neckline.
- Look for added confirmation from high trading volume or strong bearish candles.
What to expect after a triple top pattern
Once a triple top pattern is confirmed, traders may enter short positions on the confirmed breakdown or after a retest of the neckline as resistance.
For a retest trade, place a stop-loss above the retest high. A stop above the final peak is a wider alternative. Your position size should reflect the chosen stop distance. The initial profit target is calculated by subtracting the pattern’s height from the neckline.
Spot trading lets you sell crypto you own, while opening a short position requires a product that supports short selling. Stops do not guarantee an exit price, and leverage adds liquidation risk.
Key terms explained
What to watch for
A wick below support followed by a candle close above it does not meet the candle-close confirmation rule.
Volume may fade as the pattern develops, while an increase during the breakdown adds supporting evidence. It doesn’t need to decline at every peak.
Compare volume with recent candles on the same timeframe and market. One exchange’s spot volume does not represent the whole crypto market.
Also, indicators such as the Relative Strength Index can provide context, but they cannot guarantee a successful trade.
Important Read: Understanding the Rising Wedge Pattern in Crypto Trading
How to trade a triple top
Suppose you are trading BTC/USDT on the 4-hour chart. Bitcoin forms three peaks near 84,500 USDT, with neckline support at 80,000 USDT. A candle closes at 79,000 USDT, which confirms the breakdown below support. Price then retests 80,000 USDT before turning lower.
Hypothetical trade setup:
- Entry: 79,500 USDT after price turns lower following the retest.
- Stop-loss: 80,500 USDT, above the retest high.
- Take profit: 75,500 USDT. The pattern’s 4,500 USDT height is projected downward from the 80,000 USDT neckline.
This setup risks 1,000 USDT per BTC for 4,000 USDT of potential profit, giving a 4:1 reward-to-risk ratio before costs.
For a 1,000 USDT account, a chosen 1% risk budget equals 10 USDT. Dividing this by the 1,000 USDT stop distance gives a position size of 0.01 BTC, before allowing for fees, holding costs, and slippage.
Note: The target remains an estimate, and actual losses can exceed the planned amount.
When the pattern fails
A recovery above the neckline weakens the breakdown, particularly if price holds above it. A sustained move above the three-peak resistance zone invalidates the bearish setup.
A retest trade can hit its stop without invalidating the entire pattern. Follow the trade’s planned exit: do not wait for a candle close after a protective stop triggers.
Reassess the chart before you consider another entry.
Final thoughts
A triple top pattern can help traders recognize a possible bearish reversal. To assess the setup, use a confirmed support break, an estimated target, and a defined loss budget. Skip setups where the potential return does not justify the risk.
FAQs
Is a triple top bullish or bearish?
A triple top is a bearish reversal pattern that forms after an uptrend, but three peaks alone don’t confirm it; a candle must close below the neckline support.
How is a triple top different from a double top?
A double top has two peaks, while a triple top has three. Both require a support break to confirm the bearish setup.
Does price always retest the neckline?
No. Price may continue falling without a retest. Waiting can mean missing the move.
Which timeframe is best for a triple top?
There is no universally best timeframe to trade a triple top pattern. Choose one that matches your trading plan and test its results, including trading costs.
Can a confirmed triple top fail?
Yes. Price can recover above support or resistance. Confirmation identifies a setup, but does not guarantee a profitable trade.
Sign up on WEEX and roll for a chance to win a share of the $1,000,000 prize pool.