Solana Just Boosted Block Capacity by 66%. Why Is SOL Still Struggling?
Solana activated a 66% block-capacity increase on July 29, giving the network more room during periods of heavy trading and payment activity. The upgrade improves how much work can fit into each block but does not make individual transactions 66% faster or create automatic SOL demand. SOL remained near $74 after activation and is now compressing inside an emerging falling wedge on the 4-hour chart. Buyers must defend $72 and break above wedge resistance before $76 and $78 come back into reach.
Key Takeaways
- Solana raised its maximum block capacity from 60 million to 100 million compute units.
- Around 11.2% of blocks had used at least 56 million compute units under the previous limit.
- The upgrade adds parallel capacity while leaving the per-account compute limit unchanged.
- SOL is compressing inside a falling wedge. A 4-hour close above wedge resistance would improve the structure, while a breakdown below $72 could expose $70.
Solana Activates 100M CU Blocks on Mainnet
Solana’s 100 million compute-unit block limit activated on mainnet on July 29 at the start of epoch 1009. The change raised the maximum block capacity from 60 million to 100 million compute units, a 66% increase.
Compute units measure the work required to process transactions. Raising the block-level ceiling allows validators to include more total activity in each block without changing how applications are built. The upgrade was introduced through SIMD-0286 and had already activated on testnet and devnet before reaching mainnet.
Previous Blocks Were Already Testing the Limit
Solana said 11.2% of blocks produced between July 22, 2025 and the latest upgrade used at least 56 million compute units.
Roughly one in nine therefore came close to the previous 60 million limit, mainly during volatile periods when transaction demand arrived in bursts.
The increase does not remove every source of congestion. Solana kept the maximum writable-account limit at 12 million compute units. A heavily used market or application can still reach that ceiling, but it now consumes a smaller share of the entire block. More unrelated transactions can also be processed alongside it.
Current traffic is also largely not constrained by block execution times. Solana expects to maintain its existing 400ms block time, so the upgrade basically adds throughput and headroom rather than making each transaction 66% faster.
More Capacity Does Not Guarantee SOL Demand
The upgrade can support higher activity across decentralized finance, trading and payments. Its effect on the token remains indirect.
Users already need SOL for network fees, while validators use it within Solana’s staking system. Higher activity could increase token use over time, but activating larger blocks does not require traders or developers to buy more SOL immediately.
The immediate benefit belongs to the network. A stronger token-demand effect would depend on whether applications and users make sustained use of the added capacity.
Initial Price Reaction was Limited After Activation
CoinGecko data showed SOL trading near $74.33 today (July 29th), down 1.1% over 24 hours and 4.7% over seven days. Its 24-hour range stretched from $72.43 to $76.12, while trading volume stood near $1.8 billion.
The token did not produce a decisive positive response after the upgrade went live. That does not show that traders rejected the change because infrastructure improvements often affect usage over a longer period. It does show that the activation alone was not enough to push SOL out of its recent price structure.
Another think to note is that the price has not dropped drastically either which means this didn’t turn into “sell the news” event either.
Solana Technical Analysis on the 4-Hour Chart
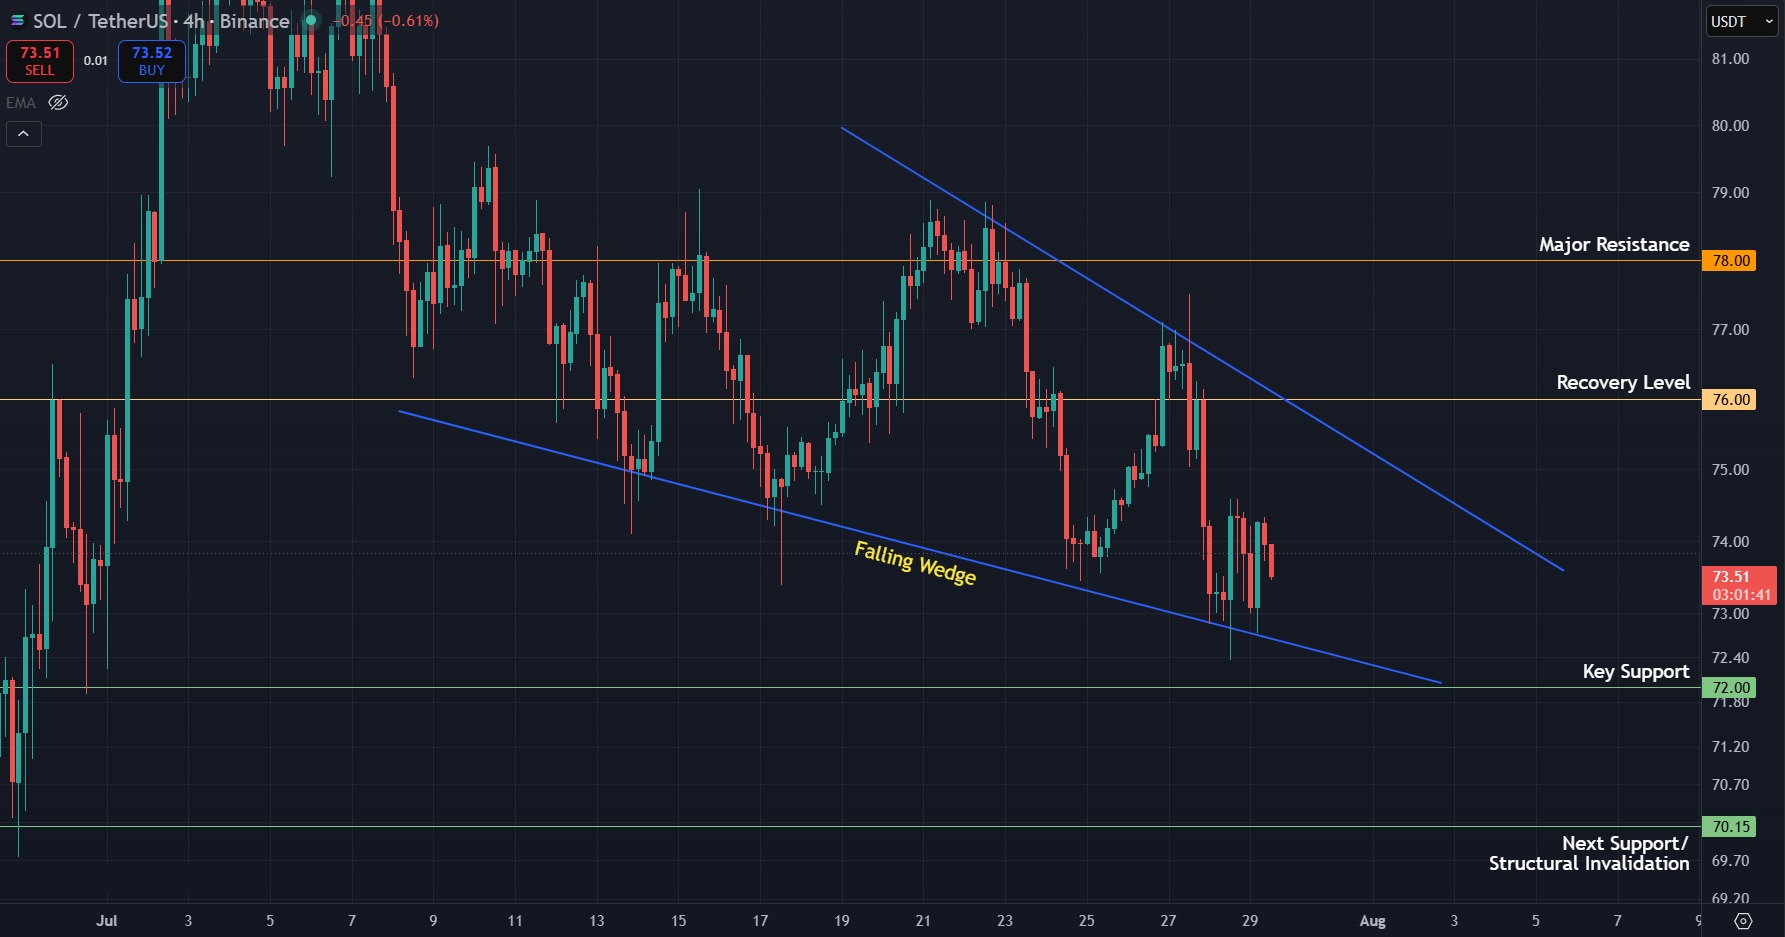
SOL/USDT 4-hour chart. Chart via TradingView.
SOL is compressing inside an emerging falling wedge, with lower highs forming beneath the upper trendline and declining swing lows holding along a shallower support line.
The falling wedge is generally considered a bullish chart pattern as it usually hints toward selling pressure weakening.
The lower boundary has produced several reactions, while the upper boundary connects the July 21 peak with the lower high formed on July 27. The structure is credible enough to monitor, although it remains unconfirmed until price breaks one of the boundaries.
The upper trendline is falling faster than the lower one, gradually narrowing the space available to price. This shows that sellers continue to cap each recovery, but the pace of the decline is also compressing rather than accelerating.
SOL currently trades in the lower half of the wedge. The lower trendline is approaching the $72 horizontal support, creating confluence between the pattern boundary and a level buyers have already defended.
A 4-hour close below both the trendline and $72 would invalidate the wedge support and expose $70. A close below $70 would invalidate the immediate recovery thesis and confirm that the pattern resolved lower.
For buyers, a 4-hour close above the upper trendline would provide the first breakout signal. The trendline is dynamic, so its exact value will fall as the structure develops.
A trendline break alone would not fully confirm a recovery. SOL must also reclaim $76, which rejected the latest rebound and sits above the recent lower highs.
Clearing both the wedge resistance and $76 would open another test of $78. The widest part of the wedge spans roughly $4, placing a conservative breakout objective close to the same resistance.
The structure remains cautious while SOL stays inside the wedge. The network upgrade may support sentiment, but price still needs to confirm that buyers are regaining control.
What to Expect Next
- Bullish case: A 4-hour close above wedge resistance followed by a reclaim of $76 could open a move toward $78.
- Bearish case: A close below the lower trendline and $72 would confirm a bearish breakdown and expose $70.
- Key catalyst: Evidence that network activity begins using the additional block capacity following the mainnet activation.
- Invalidation: A 4-hour close below $70 would invalidate the immediate recovery thesis.
Does the block-capacity upgrade guarantee a SOL rally?
No. The upgrade strengthens Solana’s infrastructure, but SOL still needs demand and a confirmed price breakout.
Is the falling wedge already bullish?
No. The pattern only gains bullish significance after SOL closes above its upper trendline.
What happens if SOL loses $72?
A 4-hour close below $72 and the lower trendline would expose $70 and invalidate the wedge support.
Please view the full disclaimer at: https://themoonshow.com/disclaimer
Get started on WEEX with a simple 40 USDT reward. Deposit 100 USDT, make your trade, and claim the bonus

Bitcoin and Ethereum Quarterly Returns 2026: Q1-Q3 Trends and Q4 Outlook
Quarterly returns for Bitcoin (BTC) and Ethereum (ETH) offer a simple way to measure how the tw...

LINK Breaks August High as Chainlink Expands Into Global Payments
LINK is holding above $13 on September 7 after gaining 9.9% in the previous session. The move c...

XRP ETF Inflow Streak Ends After $170M Run. Can Price Hold $1.31?
XRP is trading near $1.36 on September 3 after U.S. spot XRP ETFs recorded their first net outf...