
Bitcoin and Ethereum Quarterly Returns 2026: Q1-Q3 Trends and Q4 Outlook
Quick Summary: In 2026, Bitcoin returned -22.2% in Q1 and -14.09% in Q2, while it is up 33.86% in Q3-to-date. Ethereum moved more sharply, falling 29.26% in Q1 and 25.28% in Q2 before gaining 57.25% in Q3-to-date. The Q1 and Q2 losses were largely driven by tariff shocks, geopolitical tensions, heavy liquidations, and ETF outflows. The Q3 recovery has been supported by stronger ETF inflows, corporate Bitcoin accumulation, improving market liquidity, and Ethereum-specific factors such as higher staking and falling exchange balances. Q4 performance will likely depend on Fed policy, ETF flow continuity, regulatory developments, Mt. Gox October repayment deadline, and Ethereum’s Glamsterdam upgrade.
Key Takeaways
- During Q1 and Q2 2026, Bitcoin and Ethereum posted back-to-back losses before rebounding sharply in Q3-to-date.
- Losses in Q1 were driven by tariff uncertainty, geopolitical tensions, heavy liquidations, and ETF selling, while Q2 remained under pressure from renewed geopolitical risks, Bitcoin ETF outflows, and Gox wallet movements.
- The Q3-to-date rebound (BTC +33.86%, ETH +57.25%) has been supported by S. spot ETF inflows ($2.62 billion combined in one week alone), corporate Bitcoin accumulation, improved Treasury-market liquidity, and Ethereum’s rising staking ratio (34.7%) and its upcoming Glamsterdam upgrade.
- Q4 performance likely depends on Fed policy, continued ETF inflows, regulatory progress, and the Mt. Gox October repayment rather than seasonality alone.
Quarterly returns for Bitcoin (BTC) and Ethereum (ETH) offer a simple way to measure how the two leading cryptocurrencies perform across changing market conditions. These returns reveal shifts in momentum, interest rates, market liquidity, institutional demand, regulation, and derivatives positioning. BTC and ETH have different supply and network fundamentals, which can cause their returns to diverge significantly.
According to Coinglass data, Bitcoin’s quarterly returns in 2026 were -22.2% in Q1, -14.09% in Q2, and +33.86% in Q3-to-date. Ethereum fell 29.26% in Q1 and 25.28% in Q2 before gaining 57.25% in Q3-to-date. Multiple factors contributed to these swings, including macro shocks, ETF flow reversals, liquidation cascades, and network-specific catalysts.
Bitcoin and Ethereum Quarterly Returns in 2026
Quarterly returns measure the percentage change in an asset’s price between the beginning and end of a calendar quarter. Q1 covers January through March, Q2 April through June, Q3 July through September, and Q4 October through December.
Coinglass tracks quarterly returns for Bitcoin and Ethereum in 2026.
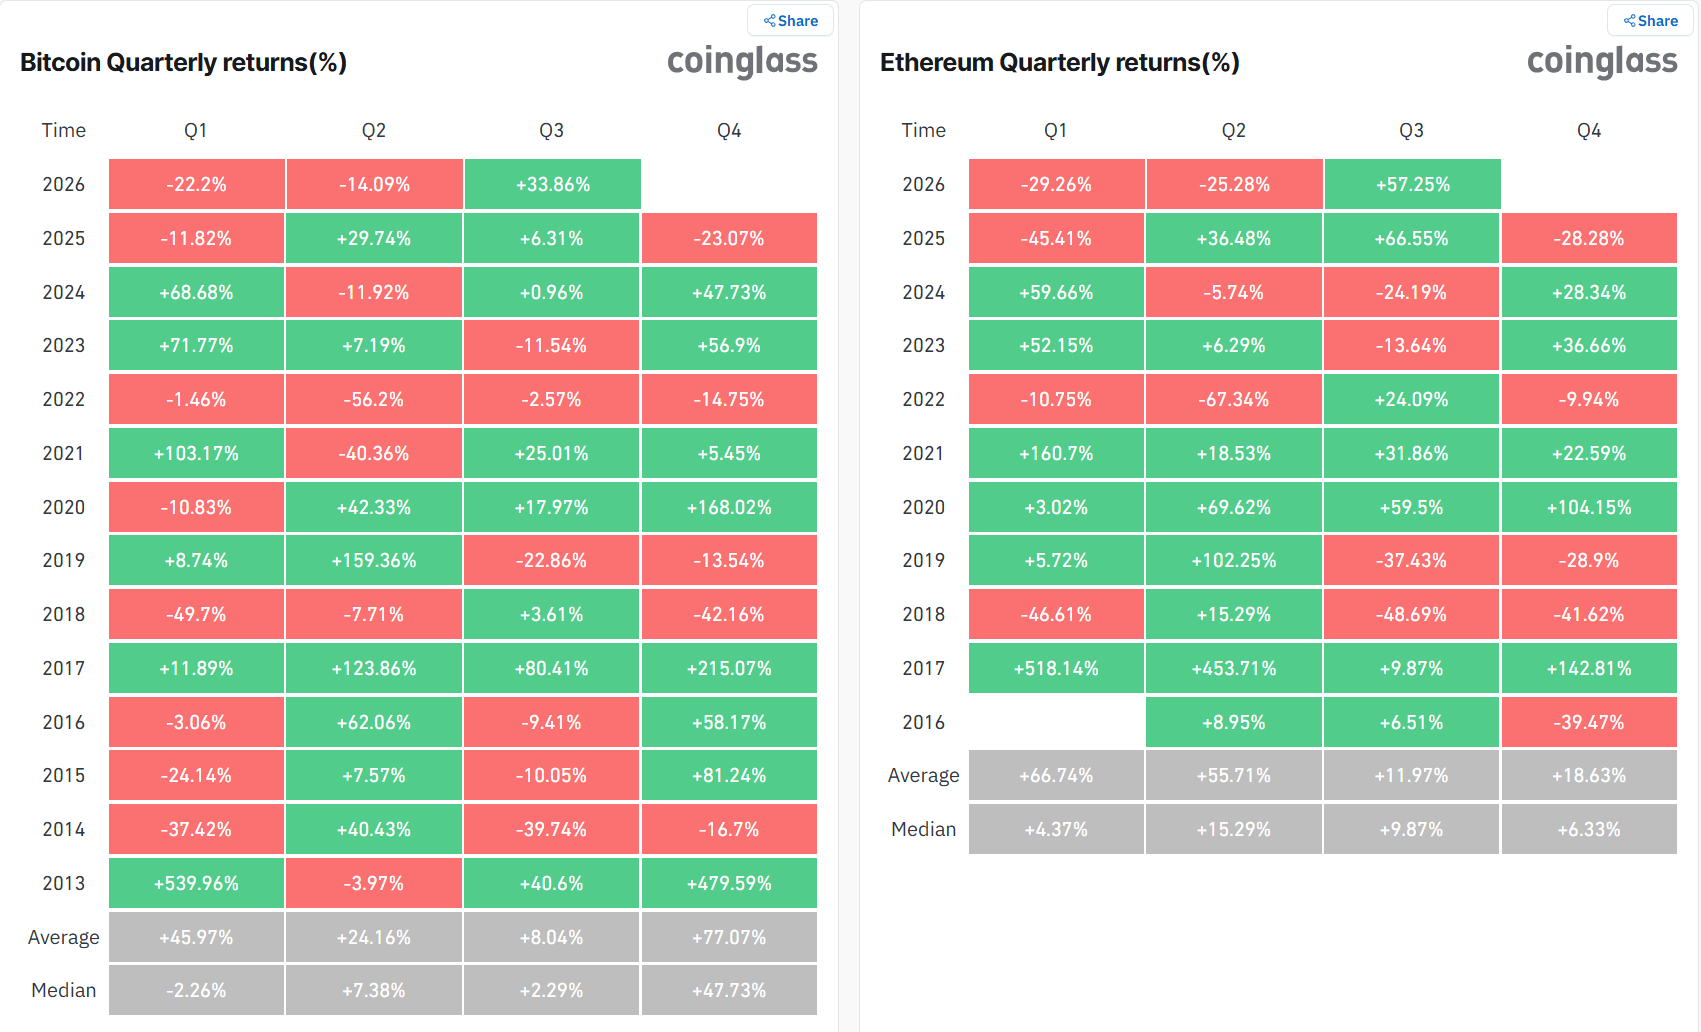
(Source: Coinglass)
The data shows that two consecutive losing quarters to start a year are unusual for Bitcoin. Before 2026, Bitcoin had recorded back-to-back Q1 and Q2 losses only twice, in 2018 and 2022, while Ethereum has suffered even steeper losses.
In 2026, the direction changed in Q3-to-date. Ethereum’s 57.25% gain is 23.39 percentage points higher than Bitcoin’s 33.86% return. This shows how aggressively ETH can move when crypto market sentiment turns positive.
Average Q4 Returns: Useful Context, Not a Forecast
According to the Coinglass data, Bitcoin’s average Q4 return is 77%, but its Q4 median is 47.73%. This shows how exceptional bull-market quarters have lifted the historical mean.
| Bitcoin Average Quarterly Returns Since 2013 | ||||
| Time | Q1 | Q2 | Q3 | Q4 |
| Average | +45.97% | +24.16% | +8.04% | +77.07% |
| Median | -2.26% | +7.38% | +2.29% | +47.73% |
The historical pattern for Ethereum varies.
Ethereum’s average Q4 return is 18.63%, while its Q4 median is 6.33%. This shows that a few strong bull-market quarters have pulled the historical mean higher.
| Ethereum Average Quarterly Returns Since 2016 | ||||
| Time | Q1 | Q2 | Q3 | Q4 |
| Average | +66.74% | +55.71% | +11.97% | +18.63% |
| Median | +4.37% | +15.29% | +9.87% | +6.33% |
These figures provide historical context, not evidence that Q4 must produce positive returns.
Q1 2026: Tariffs, Geopolitics, and a Record Derivatives Unwind
Bitcoin's 22.2% Q1 loss was driven mainly by macro pressure. Trump's late-February announcement of a 15% global tariff pushed inflation expectations higher and reduced hopes for Fed rate cuts. CME FedWatch showed the odds of a March rate cut fell to 4%-6%, down from more than 20% a month earlier. With the 2025 rally tied largely to expected rate cuts, investors rotated out of digital assets, while ETF redemptions added direct selling pressure on Bitcoin.
Geopolitical risks further deepened the sell-off. On February 28, U.S.-Israeli strikes on Iran sent Bitcoin from roughly $65,500 to $63,000 within an hour and triggered more than $515 million in liquidated leveraged positions over 24 hours. A separate five-day stretch in early February saw Bitcoin post a -6.05 sigma move on a rate-of-change basis, alongside $3-4 billion in total market liquidations. The quarter ended with a record $13.5 billion options expiry on March 27, while the Crypto Fear & Greed Index remained in “Extreme Fear” for 46 consecutive days.
One offsetting structural signal was Bitcoin exchange reserves falling to seven-year lows, meaning less BTC was immediately available for sale on trading platforms. However, this tightening in liquid supply was not enough to offset the broader Q1 pressure, as BTC ETF assets also fell nearly 35% from their $128 billion mid-January high to $83.40 billion by February 27.
Ethereum’s 29.26% Q1 loss was largely driven by ETH-specific pressure. On February 6, the token fell 35% to $1,820, its lowest level since May 2025, after starting the year near $2,800. In February alone, the token fell roughly 19.6%. Co-founder Vitalik Buterin’s selling activity also added short-term headline pressure. However, the transactions were tied to a previously announced plan to fund privacy, security, open-source software, and related projects rather than simply reflecting a bearish view on ETH. Buterin had earmarked roughly 16,000-17,000 ETH for those initiatives, with the sales carried out gradually.
During Q1, U.S. spot Ethereum ETFs recorded net outflows in every month, with total redemptions reaching about $758 million for the quarter. Persistent ETF selling added to broader pressure on ETH.
Q2 2026: From Ceasefire Rally to Mt. Gox Pressure
During Q2 2026, Bitcoin recorded a 14.09% loss, while Ethereum suffered a 25.28% loss. Several key factors contributed to these losses. On April 7, the U.S. and Iran announced a ceasefire, reigniting risk appetite. It sent Bitcoin to $72,700 and squeezed out $595 million in crypto liquidations. Strategy alone purchased 34,164 BTC that month, and U.S. spot Bitcoin ETF inflows hit $2.44 billion.
However, the recovery was short-lived. In late May, the ceasefire fractured and the U.S. spot Bitcoin ETFs suffered a nine-session outflow streak totaling around $2.8 billion. On June 2, Mt. Gox moved 10,422 BTC to a new wallet, which revived fears of creditor selling ahead of the exchange’s October 2026 repayment deadline. The transfer added to selling concerns as Bitcoin subsequently fell toward $65,000 as $1.86 billion was liquidated in a single 24-hour window.
Q3 2026: Fed Policy, ETF Inflows, and Ethereum’s Network Catalysts
In Q3-to-date, Bitcoin gained 33.86%, and Ethereum increased by 57.25%. The surge reflected a reversal of pressure that dominated during the first two quarters. During August, Bitcoin broke above $69,000, and Ether surged 18% to $2,250. The move was also supported by the U.S. Treasury’s plan to increase liquidity-support buybacks for long-dated securities from up to $2 billion to at least $4 billion per operation from September 9 through November 4. The announcement eased pressure on long-dated yields and improved sentiment around Treasury-market liquidity.
August marked the strongest month of 2026 for U.S. Bitcoin ETFs, as the funds attracted $3.52 billion in inflows, up from roughly $172 million in July. Corporate treasury companies also continued to accumulate Bitcoin. According to Bitcoin Treasuries, 198 public companies hold around 1.271 million BTC.
Fed policy became a less clear-cut tailwind by early September. Fed Chair Kevin Warsh argued that AI-driven productivity gains could create more room for lower rates, but persistent inflation risks have kept the near-term outlook more hawkish. By September 9, markets were leaning toward another rate hike instead of additional easing. This shows that the Q3 macro backdrop was no longer clearly dovish.
In August, the SEC proposed Regulation Crypto Assets that would create a tailored framework for certain crypto investment contracts. The proposal included exemptions for offerings of up to $5 million during a four-year period and up to $75 million during a 12-month period. Renewed support for the Clarity Act also contributed to the positive sentiment around Bitcoin. However, the bill remains stalled in the Senate and faces a cloture vote on September 15.
During the first week of September, Fed Governor Waller signaled openness to holding rates steady as Bitcoin reclaimed $81,000. However, rate expectations remained divided, leaving the macro setup fragile.
By the end of August, Bitcoin had gained 25% during the month, while Ethereum rose more than 30%.
Ethereum’s performance is also driven by additional factors. During the week ending August 21, the U.S. spot ETH ETF attracted roughly $697 million. In July, ETH ETF flows had already turned positive with $365 million inflows. Meanwhile, Ethereum’s staking ratio climbed to 34.7%, with more than 41.9 million ETH staked, and exchange balances fell 15% from early June to mid-August.
Another key factor behind Ethereum’s Q3 surge is the upcoming Glamsterdam upgrade, the successor to Fusaka. The upgrade aims to improve scalability and network efficiency through changes, such as enshrined proposer-builder separation and block-level access lists.
Why Ethereum Outperformed Bitcoin
Ethereum's stronger performance in Q3-to-date partly reflects its higher beta, meaning ETH tends to move more sharply than BTC in both directions.
However, the rally was not driven by market beta alone. Rising staking and falling exchange balances tightened Ethereum’s liquid supply, while its upgrade roadmap strengthened sentiment around the network’s fundamentals.
Q4 2026 Outlook: What Could Shape the Next Quarter
Historically, Q4 has been Bitcoin’s strongest quarter, with October often called “Uptober.” However, seasonality cannot be guaranteed. Its impact depends on the broader market environment, and 2026 has already shifted between bearish and bullish quarters.
Several factors can determine the Q4 direction of Bitcoin and Ethereum. Monetary policy will remain central. The Fed Q4 meetings are scheduled for October 27-28 and December 8-9, and changes in inflation, interest rates, or policy expectations could affect risk appetite.
Next, continued ETF inflows could support prices, while a reversal could quickly weaken momentum, as seen in Q2. Liquidity conditions could remain supportive while Treasury’s larger long-end buybacks continue through November 4. Regulatory developments, including progress on the Clarity Act and the SEC’s October 20 comment deadline, could further influence market sentiment.
The Mt. Gox repayment deadline on October 31 also remains a potential source of selling pressure if creditors choose to cash out. For Ethereum, the Glamsterdam upgrade could provide another catalyst if implemented on schedule. However, delays could weigh on sentiment.
Together, these factors could shape Bitcoin and Ethereum's performance in Q4 2026.
FAQs
What are Bitcoin quarterly returns?
Bitcoin quarterly returns measure the percentage change in BTC’s price during each three-month calendar quarter.
What are Ethereum quarterly returns?
Ethereum quarterly returns measure the percentage change in ETH's price from the beginning to the end of Q1, Q2, Q3, and Q4.
Are Bitcoin and Ethereum's Q3 2026 returns final?
No. Q3 runs through September 30, so figures published before then are quarter-to-date returns and can change before the quarter closes.
In which quarters has Bitcoin performed better?
According to Coinglass data, Bitcoin has generally performed better in Q4 on average, although large bull-market gains and past performance do not predict future results.
What factors have the biggest impact on Bitcoin and Ethereum quarterly returns?
The key factors include Federal Reserve policy, interest rates, ETF flows, leverage, liquidity, regulation, and investor sentiment. Supply dynamics and treasury demand can also influence Bitcoin, while staking, network activity, and protocol upgrades can influence Ethereum.
How should investors use quarterly return data?
Quarterly return data can help investors understand market trends and compare digital asset performance across periods. Instead of using it as a standalone trading signal, investors should combine it with ETF flows, interest rates, leverage, and network fundamentals.
Get started on WEEX with a simple 40 USDT reward. Deposit 100 USDT, make your trade, and claim the bonus.
Disclaimer: All content on The Moon Show is for informational and educational purposes only. The opinions expressed do not constitute financial advice or recommendations to buy, sell, or trade cryptocurrencies. Trading involves significant risk and may result in substantial losses. Always seek independent financial advice before making investment decisions. The Moon Show is not responsible for any financial losses or decisions made based on the information provided.
Please view the full disclaimer at: https://themoonshow.com/disclaimer

LINK Breaks August High as Chainlink Expands Into Global Payments
LINK is holding above $13 on September 7 after gaining 9.9% in the previous session. The move c...

XRP ETF Inflow Streak Ends After $170M Run. Can Price Hold $1.31?
XRP is trading near $1.36 on September 3 after U.S. spot XRP ETFs recorded their first net outf...

UNI Extends Rally as Robinhood Chain Activity Strengthens Uniswap Burn Story
Uniswap is extending its late-August rally as activity on Robinhood Chain accelerates. UNI is t...