 Price Prediction: Symmetrical Triangle Breakout Signals Short-Term Upside Potential")
Ethereum (ETH) Price Prediction: Symmetrical Triangle Breakout Signals Short-Term Upside Potential
Ethereum is currently trading around the $4,200 mark and is finally gaining momentum on the lower timeframes. As discussed in our previous analysis, the $3,800 zone acted as a key support level for ETH, which the bulls managed to defend once again. At the moment, Ethereum is breaking out on the lower timeframes, and several indicators are confirming a short-term bullish move within the broader downtrend. Let’s take a closer look at the latest Ethereum charts to understand where the price might be headed in the coming days.
Our Ethereum Price Prediction Summary
- Ethereum is holding firm above $3,800 support while testing the $4,250 resistance that could decide its next move.
- A breakout above $4,250 could push ETH toward $4,500, but failure may trigger a pullback to $4,050.
- The overall outlook remains neutral as traders wait for confirmation of a clear trend reversal.
Join WEEX and verify your account to claim a 10–100 USDT coupon. Fund your account to access deposit bonuses and ongoing trading rewards.
Analyzing the Charts
Ethereum Holds Strong Above $3,800 Support
On the 4-hour chart, ETH continues to hold firm above the $3,800 support zone, with the price repeatedly bouncing from this level despite several bearish attempts to take control. The chart also shows that Ethereum has formed a Symmetrical Triangle pattern, which is now breaking out to the upside. A Symmetrical Triangle is generally considered a neutral pattern, but when combined with another bullish indicator that we will get to shortly on the daily timeframe, this breakout further strengthens the ongoing bullish momentum on the lower timeframes.
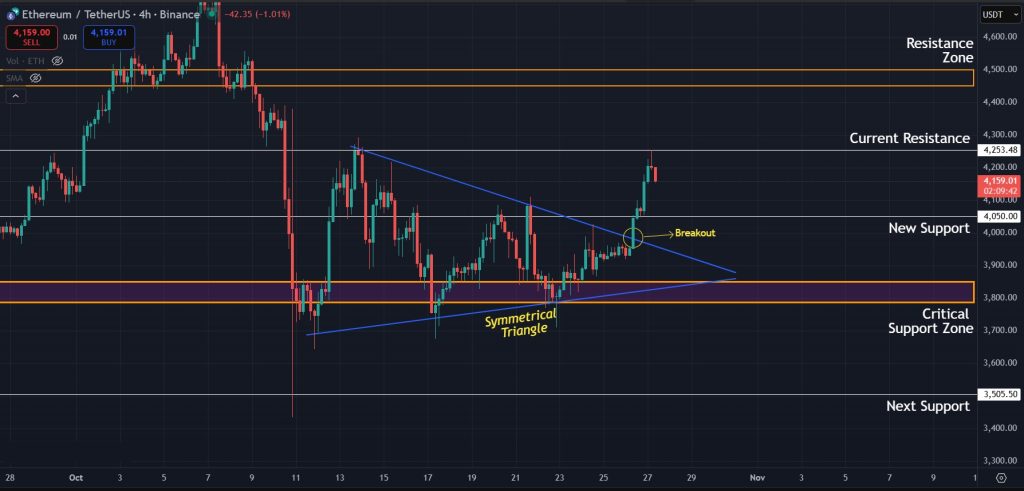
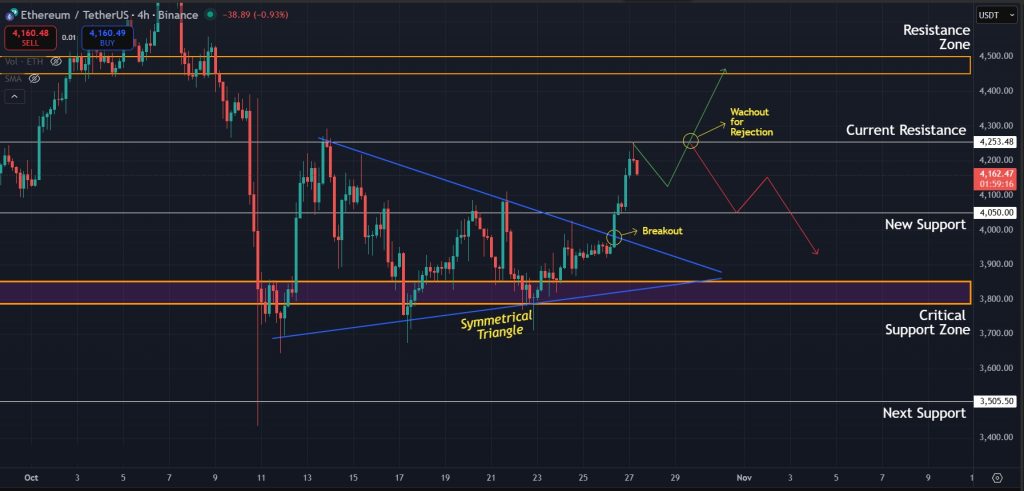
Bullish Breakout Faces Critical Resistance Ahead
The breakout target for this Symmetrical Triangle is around $4,500, which also aligns with a key resistance zone. The broader trend, however, has not yet reversed, so ETH needs to break above $4,250 to confirm real strength. That level is currently acting as resistance and continues to push the price down on micro timeframes. A clear move above it would give the bulls stronger control and could open the path toward higher levels. However, if the price fails to break through, momentum will likely fade, and ETH may pull back toward the $4,050 support area, which recently flipped from resistance.
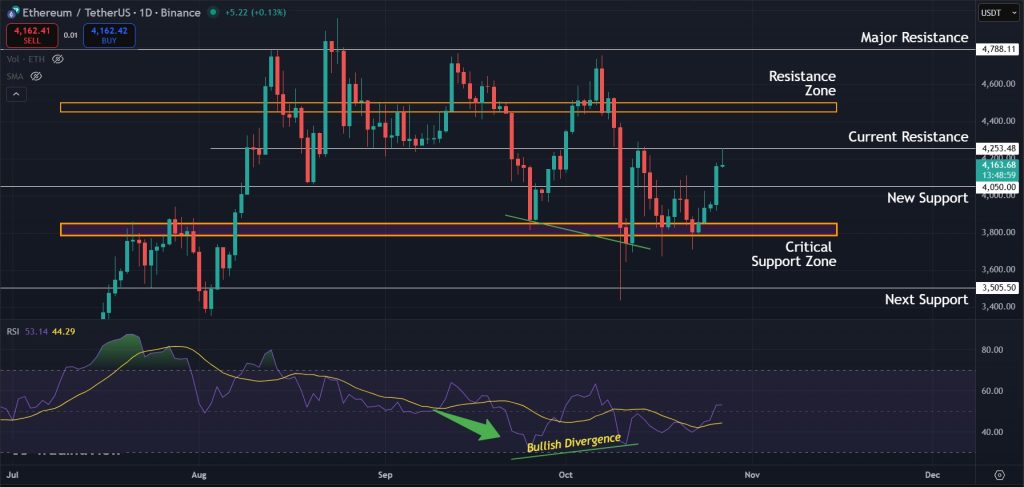
RSI Divergence Adds Strength to Bullish Setup
The 1-day chart reflects a similar setup, with the same critical levels in focus. ETH must break above $4,250 and then $4,500 to form a higher high and confirm a shift in trend toward the bulls. The current momentum appears to stem from a bullish divergence on the RSI that developed on the daily chart, which we did highlight in our previous analysis. This signal worked in line with the Symmetrical Triangle on the 4-hour chart and fueled the ongoing upward move. For now, our Ethereum price prediction remains neutral as we watch how the price reacts to the $4,050 support if the rejection at $4,250 continues.
Final Takeaway: What is Next for Ethereum?
Ethereum is showing renewed strength on the lower timeframes, supported by a breakout from the Symmetrical Triangle pattern and a bullish divergence on the RSI. However, the broader trend has not yet flipped fully in favor of the bulls. The next move will depend on how ETH reacts to the $4,250 resistance and whether it can hold above $4,050 support. A confirmed breakout above $4,250 could open the path toward $4,500 and potentially higher levels, while another rejection may lead to short-term consolidation or a retest of lower support zones. Overall, ETH is in a neutral zone for now, with traders watching these key levels closely for confirmation of the next major move.
Join WEEX today and walk away with a deposit bonus, a coupon worth up to 100 USDT, and trading rewards that grow as you trade more.
Disclaimer: All content on The Moon Show is for informational and educational purposes only. The opinions expressed do not constitute financial advice or recommendations to buy, sell, or trade cryptocurrencies. Trading involves significant risk and may result in substantial losses. Always seek independent financial advice before making investment decisions. The Moon Show is not responsible for any financial losses or decisions made based on the information provided.
Please view the full disclaimer at: https://themoonshow.com/disclaimer

Bitcoin Drops Toward $62K As Chip Selloff And Strategy Warning Pressure BTC
Bitcoin came under pressure again on June 24 as the wider selloff in chip and AI-linked stocks ...

XRP Slides Toward $1.10 As Buyers Face Another Support Test
XRP is back near a level buyers have defended several times this month. The token traded close ...

Bitcoin Holds Near $65K as Bear-Flag Warning Keeps $60K In Focus
Bitcoin held near $65K as traders weighed a bearish chart warning, cautious derivatives positio...