 Price Prediction: Ethereum's Rejection at $4,050 Signals Continued Weakness")
Ethereum (ETH) Price Prediction: Ethereum's Rejection at $4,050 Signals Continued Weakness
Ethereum is currently trading around the $3,900 mark, continuing its recent overall struggle. As highlighted in our previous analysis, the price saw a temporary rebound following a bullish divergence on the 1-day timeframe. However, that bounce was strongly rejected by the key $4,200 resistance level, and ETH has since struggled to establish any meaningful upward momentum. The overall short-term trend now appears clearly bearish. With the broader crypto market also losing steam today, we anticipate that lower price levels for ETH could soon come into play. Let's take a quick look at the latest ETH charts to determine exactly where the price might be headed in the coming days.
Our Ethereum Price Prediction Summary
- The immediate trend is bearish, confirmed by failure to reclaim $4,050 and resistance from the 100-day SMA.
- The $3,800 support is the critical line that bulls must defend.
- A loss of the $3,800 support will likely trigger a correction toward the $3,500 level.
Join WEEX and verify your account to claim a 10–100 USDT coupon. Fund your account to access deposit bonuses and ongoing trading rewards.
Analyzing the Ethereum Charts
Increasing Selling Pressure
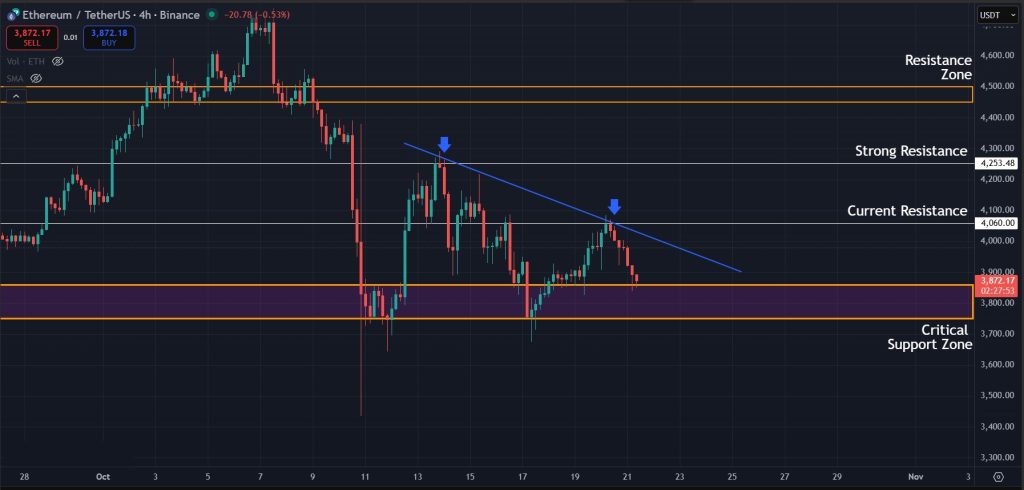
Looking at the latest 4-hour chart for Ethereum, the support zone around the $3,800 region has held up well, with the price bouncing multiple times since the flash crash on October 10th. However, we can also observe that the price is forming lower highs after each bounce, which is a clear indication of increasing selling pressure. The resistance at the $4,050 level has already been rejected, and ETH is now moving to retest the $3,800 support zone once more. This retest will be a critical point for the bulls, as bears are expected to push for a decisive break below this support with strong momentum.
Bearish Momentum Targets $3,500
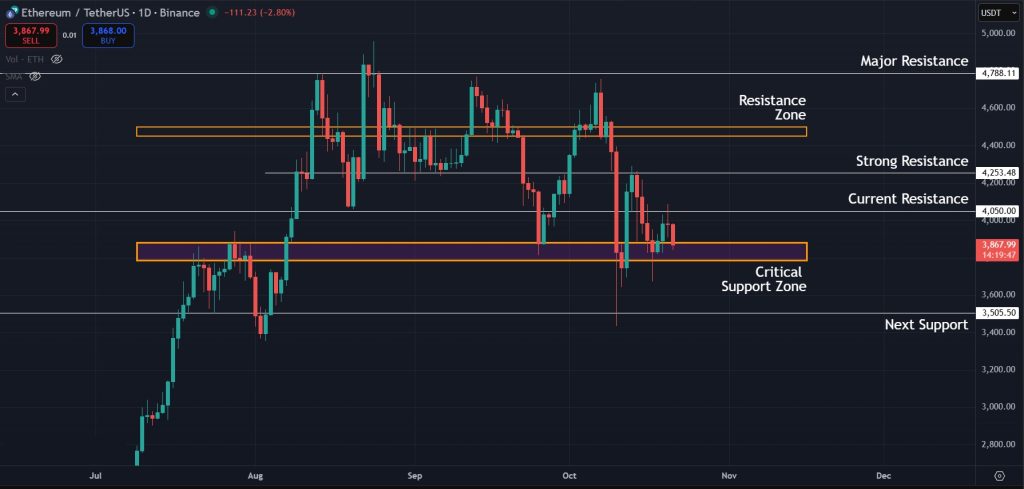
Switching our focus to the 1-day timeframe, the key price levels for ETH remain quite similar to the shorter-term view. On this daily chart, the critical $3,800 support zone remains the main area of interest, as it is currently helping ETH avoid a deeper sell-off. If the price breaks decisively below this level, confirming the move by closing daily candles below $3,800, it would trigger a significant further correction, bringing much lower levels into play. In that bearish scenario, the first major support level to watch would be the $3,500 mark. This technical outlook confirms why our current Ethereum price prediction is leaning toward the bearish side.
100-Day SMA Confirms Mid-Term Downtrend
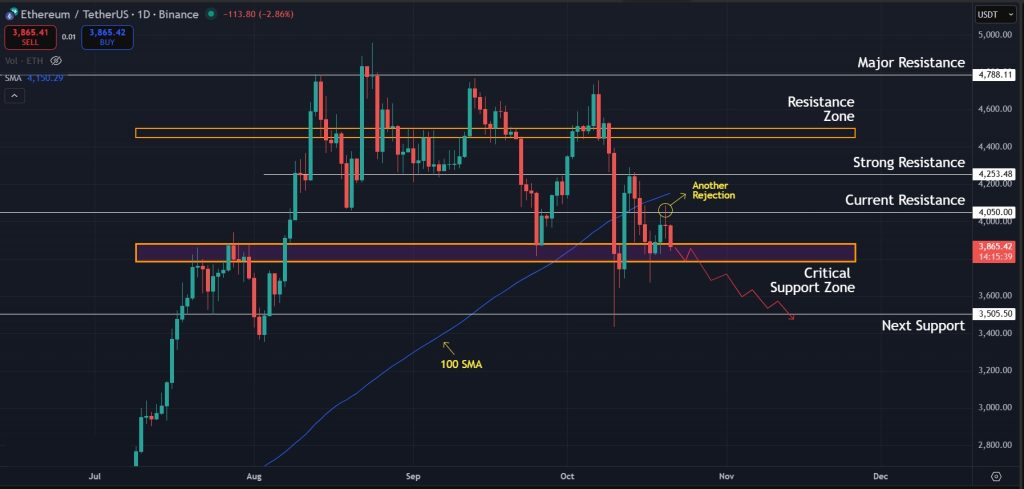
From a broader perspective, the long-term trend for Ethereum also remains bearish. We observe that the price is currently trading below the 100-day Simple Moving Average (SMA) on the daily timeframe. Historically, when the price remains below this key moving average, it confirms a bearish mid-term trend and suggests a higher likelihood of further correction.
Final Takeaway: What is Next for Ethereum?
To sum it up, the technical indicators confirm a prevailing bearish bias for Ethereum in the immediate future. The failure to reclaim the $4,050 resistance and the sustained pressure beneath the 100-day SMA are the key indicators pointing to downside risk. The critical battleground is the $3,800 support zone. If bulls fail to defend this price, it will likely confirm a deeper correction toward the $3,500 level and even lower in coming weeks. Traders should watch the $3,800 support very closely, as its defense or failure will dictate ETH's direction for the coming weeks.
Register on WEEX and verify your identity to earn up to 100 USDT. Deposit funds and participate in trading to access further rewards.
Disclaimer: All content on The Moon Show is for informational and educational purposes only. The opinions expressed do not constitute financial advice or recommendations to buy, sell, or trade cryptocurrencies. Trading involves significant risk and may result in substantial losses. Always seek independent financial advice before making investment decisions. The Moon Show is not responsible for any financial losses or decisions made based on the information provided.
Please view the full disclaimer at: https://themoonshow.com/disclaimer

Bitcoin Drops Toward $62K As Chip Selloff And Strategy Warning Pressure BTC
Bitcoin came under pressure again on June 24 as the wider selloff in chip and AI-linked stocks ...

XRP Slides Toward $1.10 As Buyers Face Another Support Test
XRP is back near a level buyers have defended several times this month. The token traded close ...

Bitcoin Holds Near $65K as Bear-Flag Warning Keeps $60K In Focus
Bitcoin held near $65K as traders weighed a bearish chart warning, cautious derivatives positio...