
Bitcoin Tests $65K As ETF Flows Try To Repair Last Week’s Damage
Bitcoin is back near $65,000 after spot ETF flows improved from last week’s sharp outflow. Farside Investors data shows U.S. spot Bitcoin ETFs lost $424.7 million on July 13, then brought in $500.2 million across the next four reported sessions. That sounds strong on its own, but the five-session net is only about $75.5 million after including the July 13 outflow. The data points to stabilization, not a flood of new demand. BTC is now trading close to $65,000, with the intraday high near that area. A clean move above $65,000 would put $66,000 back in focus, while another rejection would keep Bitcoin exposed to a pullback.
Key Takeaways
- Bitcoin is testing the $65,000 area after spot ETF flows improved.
- U.S. spot Bitcoin ETFs lost $424.7 million on July 13, according to Farside Investors.
- The same funds added $500.2 million from July 14 to July 17.
- After counting the July 13 outflow, the five-session net is only about $75.5 million.
- BTC needs a clean move above $65,000 to confirm stronger short-term control.
ETF Flows Mostly Repair Last Week’s Hit
U.S. spot Bitcoin ETFs had a significant outflow last week. Farside Investors data shows the funds lost $424.7 million on July 13, with large outflows from IBIT and FBTC.
The next four reported sessions helped repair that damage. Bitcoin ETFs added $181.1 million on July 14, $107.7 million on July 15, $79.1 million on July 16 and $132.3 million on July 17.
Together, those four inflow days brought in $500.2 million. After subtracting the July 13 outflow, the net change across the five-session stretch is about $75.5 million.
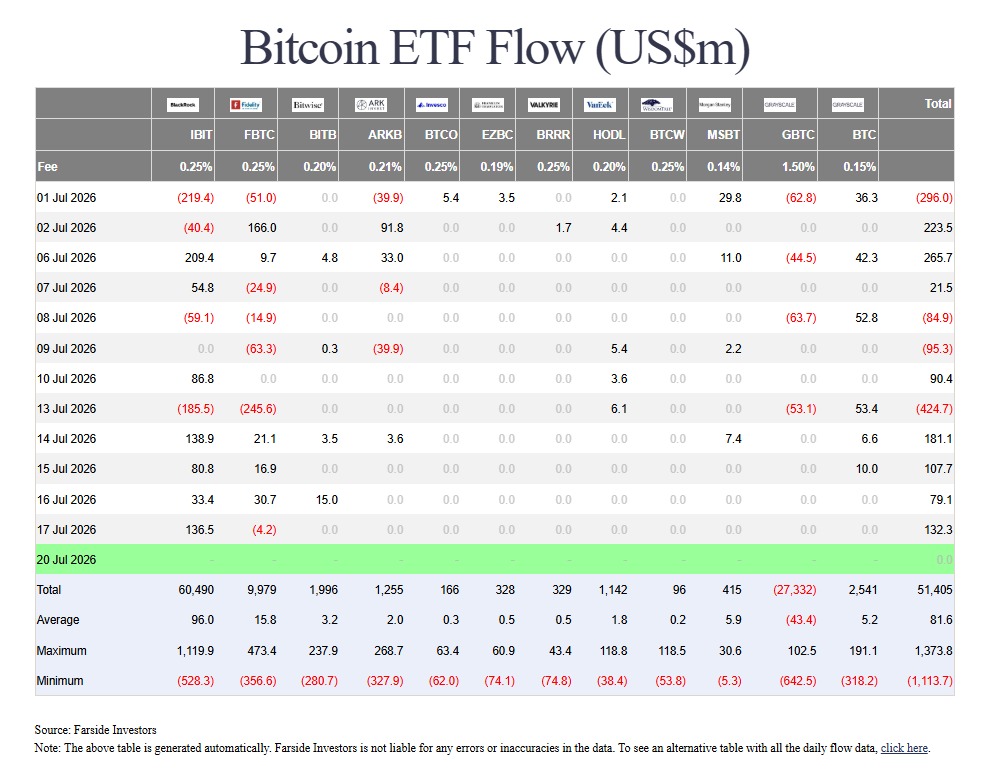
Bitcoin ETF flow data. Chart via: Farside Investors
That shows ETF flows are no longer putting the same pressure on Bitcoin, but they have not turned into a major demand wave either. They have mostly offset one heavy redemption day.
For BTC, that still helps. The market has moved from ETF pressure to modest ETF support, which gives buyers a better setup as price returns to the $65,000 area.
BTC Returns To $65K With a Narrow ETF Cushion
CoinMarketCap data showed Bitcoin trading near $65,000 on July 20, with the intraday high close to that level.
The move comes after ETF flows improved, but the cushion is still narrow. A five-session net inflow of about $75.5 million is enough to calm the pressure from last week’s outflow, but it is not large enough to make the breakout automatic.
That is why the $65,000 test still needs price confirmation. Bitcoin has recovered from the lower part of its recent range, but sellers are still active near the same area where the move has been capped.
If BTC pushes above $65,000 and holds there, the improved ETF data starts to look more useful. If price fails again, the market may treat the latest inflows as stabilization rather than the start of a stronger demand wave.
Bitcoin Latest Charts Show $65K As the Breakout Test
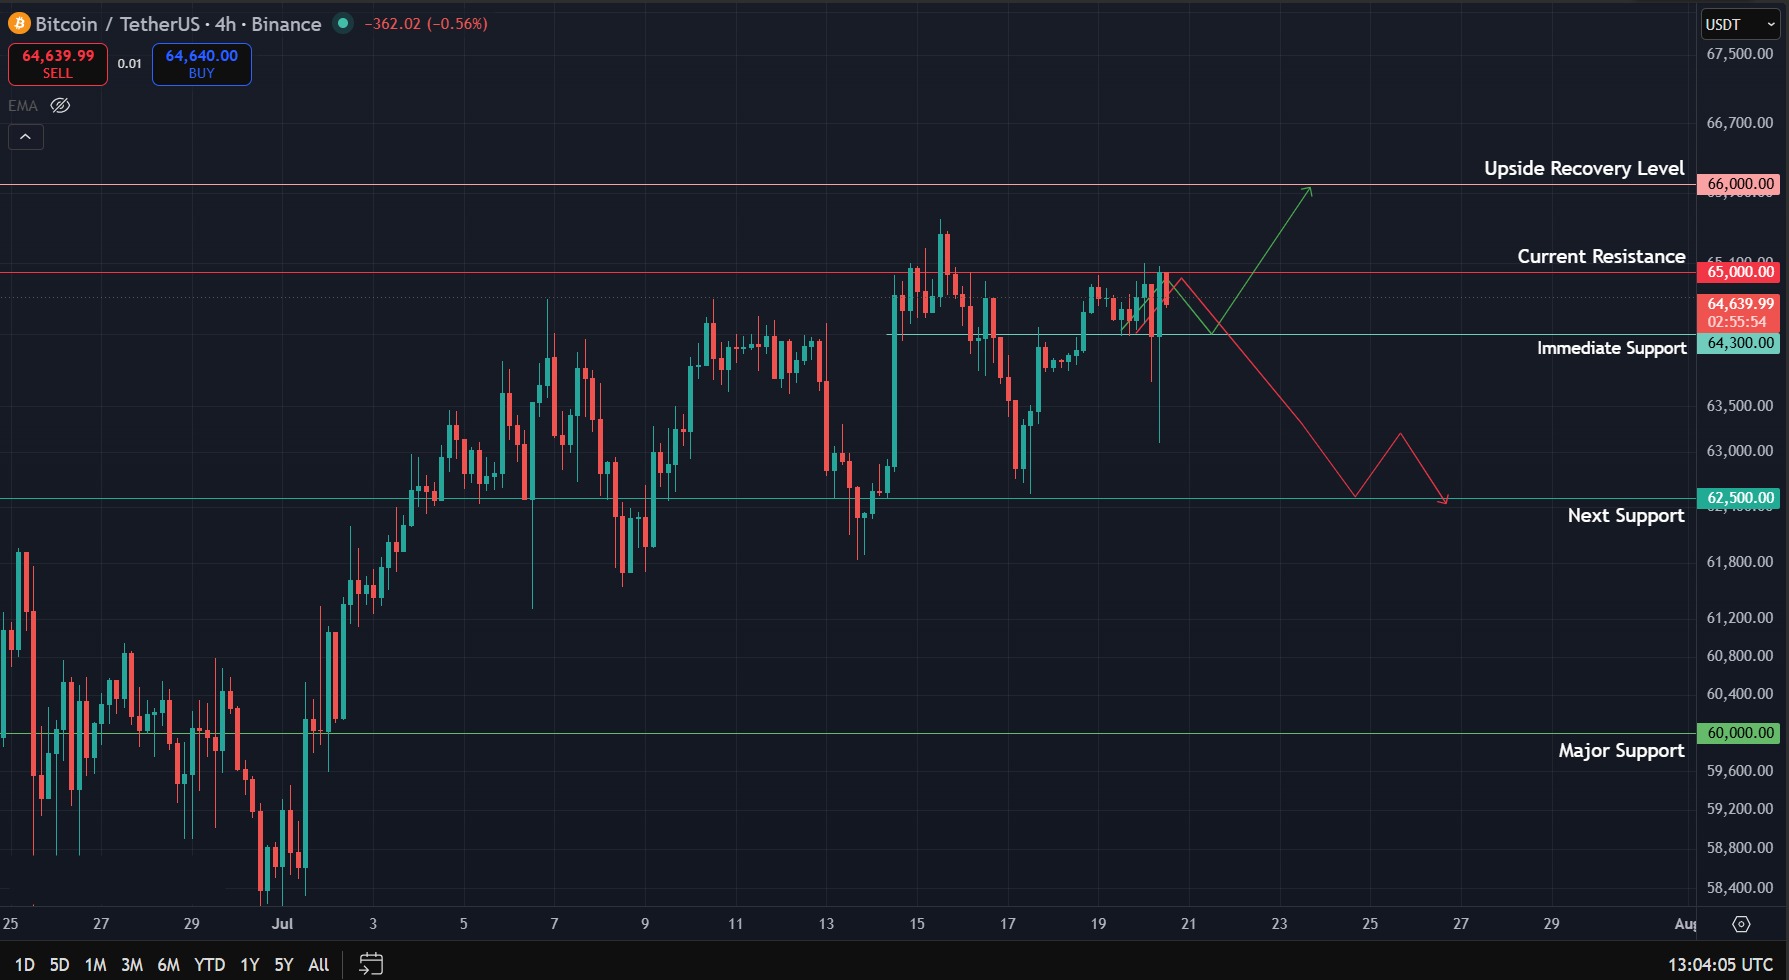
BTC/USDT 4H chart. Chart via TradingView.
Bitcoin is trading near the upper end of its short-term range after recovering from last week’s lower levels. The move has brought BTC back into the $65,000 area, where sellers have previously slowed the rebound.
The first level to watch is $65,000. BTC pushed into this area on July 20, with the intraday high near $65,012, but the move still needs a clean 4H close above it. A close and hold above $65,000 would show that buyers are starting to take control of the immediate range.
Above $65,000, the next level is $66,000. This is the first upside test if Bitcoin breaks higher. A move into $66,000 would give the chart more room and reduce the risk of another quick rejection near the current resistance area.
If BTC fails at $65,000, the first level below price is $64,300. This is the near-term pivot for the current recovery attempt. Holding $64,300 would keep BTC close enough to resistance for another attempt, while a break below it would show that the $65,000 test has failed for now.
Below $64,300, the next important support is $62,500. This is the level that matters if the rejection becomes stronger. A move back toward $62,500 would erase most of the latest push and return Bitcoin to the lower part of the recent range.
The bigger downside level remains $60,000. That level only comes back into focus if BTC loses $62,500 and the recovery from last week starts to unwind.
For now, the chart is balanced around one question. Bitcoin has returned to $65,000 after ETF pressure eased, but it has not broken through the level yet. A clean 4H close above $65,000 opens the door toward $66,000. Failure there keeps $64,300 and $62,500 in play.
What to Expect Next
- Bullish case: Bitcoin breaks above $65,000 on the 4H chart and holds that level. That would put $66,000 back in focus.
- Bearish case: Bitcoin fails at $65,000 and slips below $64,300. That would put $62,500 back on the chart.
- Key catalyst: Spot Bitcoin ETF flows remain the main driver. Continued inflows would support the breakout attempt, while another weak ETF print could slow the move.
- Invalidation: A 4H close below $62,500 would weaken the recovery setup. A clean move above $66,000 would give buyers stronger control.
Why is Bitcoin near $65,000 today?
Bitcoin is near $65,000 after spot Bitcoin ETF flows improved from last week’s heavy outflow. The recovery in flows helped reduce pressure, but BTC still needs a clean move above $65,000 to confirm stronger short-term control.
Get started on WEEX with a simple 40 USDT reward. Deposit 100 USDT, make your trade, and claim the bonus
Are Bitcoin ETF inflows strong again?
Not strongly. Farside data shows four positive sessions from July 14 to July 17, but those inflows mostly repaired the $424.7 million outflow from July 13. Across the five-session stretch, the net inflow is only about $75.5 million.
Why does the $65,000 level matter for BTC?
The $65,000 area is the main resistance Bitcoin is testing now. A clean 4H close above it would show stronger buyer control, while another rejection could keep BTC inside its recent range.
What happens if Bitcoin fails to break $65,000?
If BTC fails near $65,000 and drops below $64,300, the next support is $62,500. A move below $62,500 would weaken the recovery.
Disclaimer: All content on The Moon Show is for informational and educational purposes only. The opinions expressed do not constitute financial advice or recommendations to buy, sell, or trade cryptocurrencies. Trading involves significant risk and may result in substantial losses. Always seek independent financial advice before making investment decisions. The Moon Show is not responsible for any financial losses or decisions made based on the information provided.
Please view the full disclaimer at: https://themoonshow.com/disclaimer

Bitcoin and Ethereum Quarterly Returns 2026: Q1-Q3 Trends and Q4 Outlook
Quarterly returns for Bitcoin (BTC) and Ethereum (ETH) offer a simple way to measure how the tw...

LINK Breaks August High as Chainlink Expands Into Global Payments
LINK is holding above $13 on September 7 after gaining 9.9% in the previous session. The move c...

XRP ETF Inflow Streak Ends After $170M Run. Can Price Hold $1.31?
XRP is trading near $1.36 on September 3 after U.S. spot XRP ETFs recorded their first net outf...