
Bitcoin Holds Its Ground As Oil Spike Tests The ETF Rebound
Bitcoin traded near $63,000 on July 13 as U.S.-Iran tensions pushed oil higher and kept global markets cautious. BTC did not break down with the wider risk-off move, but it also failed to hold its intraday push above $64,000. That keeps the short-term chart balanced between support near $62,500 and resistance around $64,300. ETF flows have improved from late June, but the latest data is still uneven. Bitcoin needs to defend the lower end of today’s range and reclaim $64,300 before buyers can talk about a stronger move toward $66,000.
Key Takeaways
- Bitcoin traded near $63,000 on July 13 after failing to hold above $64,000.
- Oil prices rose as U.S.-Iran tensions returned to the center of global markets.
- Spot Bitcoin ETF flows improved on July 10, but earlier outflows still keep the rebound uneven.
- BTC is holding better than many risk assets, but buyers have not regained full control.
- The 4H chart needs BTC to hold $62,500 and reclaim $64,300. A move above $66,000 would improve the recovery.
Bitcoin Holds Near $63K As Oil Prices Jump
Bitcoin stayed near the $63,000 area on July 13 as global markets reacted to fresh U.S.-Iran tensions. CoinMarketCap data showed BTC trading around $63,000 after an intraday move toward $64,300 faded.
The wider market backdrop was still tense. AP News reported that oil prices jumped on Monday after U.S. airstrikes and Iranian retaliation, with Brent crude rising as much as nearly 5% before easing. U.S. stock futures were mixed to lower, while Asian markets saw sharper pressure.
Bitcoin’s reaction was different from a clean risk-off breakdown. BTC moved lower from the intraday high, but it did not lose the lower part of its short-term range. That gives today’s setup a more balanced tone. Traders are not chasing upside, but they are not fully abandoning BTC either.
The key question now is whether buyers can defend the $62,500 area. If that level holds, Bitcoin can still make another attempt at $64,300. If it breaks, the chart starts to point back toward the larger $60,000 support level.
ETF Flows Improve, But The Rebound Is Still Uneven
Spot Bitcoin ETF demand is not as weak as it was in late June, but the recovery is not clean yet. Farside Investors data showed U.S. spot Bitcoin ETFs recorded $90.4 million in net inflows on July 10, after outflows of $95.3 million on July 9 and $84.9 million on July 8.
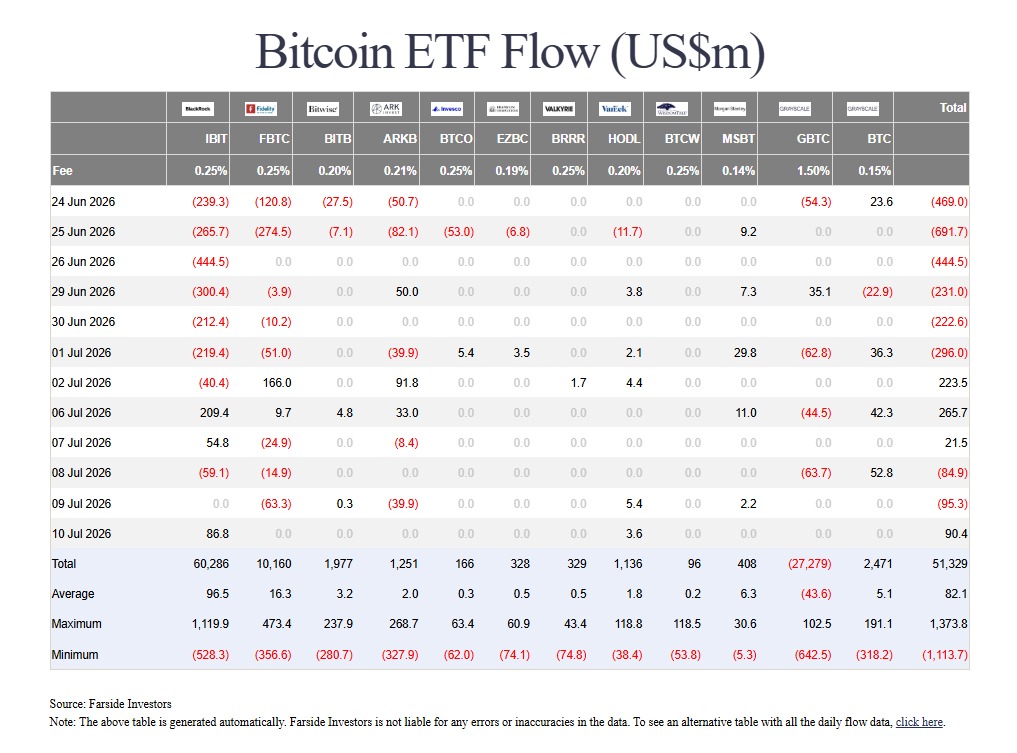
That makes the ETF picture mixed. The July 10 inflow shows buyers are still present, but the previous outflows show that demand is not strong enough yet to remove pressure from the chart.
This is important for Bitcoin because ETF flows have been one of the main drivers behind recent moves. When inflows return, BTC usually gets a stronger base. When flows turn negative again, the market becomes more sensitive to macro shocks such as oil spikes, dollar strength and falling equities.
For now, ETF demand gives Bitcoin some support, but not enough to call the recovery safe. Price still needs to prove it by holding support and reclaiming resistance.
Iran Risk Keeps Traders Defensive
The macro backdrop of war remains the main pressure point. Reuters said oil prices surged as U.S.-Iran strikes escalated and Iran claimed the Strait of Hormuz was closed, even though U.S. Central Command said around 20 ships had passed through the strait in the previous 24 hours. Reuters also noted that traders were watching June CPI data and major bank earnings this week.
That combination keeps Bitcoin in a difficult spot. Higher oil prices can feed inflation concerns, while inflation data can affect expectations for rates and liquidity. BTC can still hold up during macro stress, but it usually struggles when traders move away from risk assets.
The positive sign is that Bitcoin has not lost the $60,000 area. The weaker sign is that every push above $64,000 still needs confirmation. Until that changes, BTC remains in a defensive recovery rather than a strong breakout.
Bitcoin Technical Analysis Shows $62.5K As The Short-Term Support
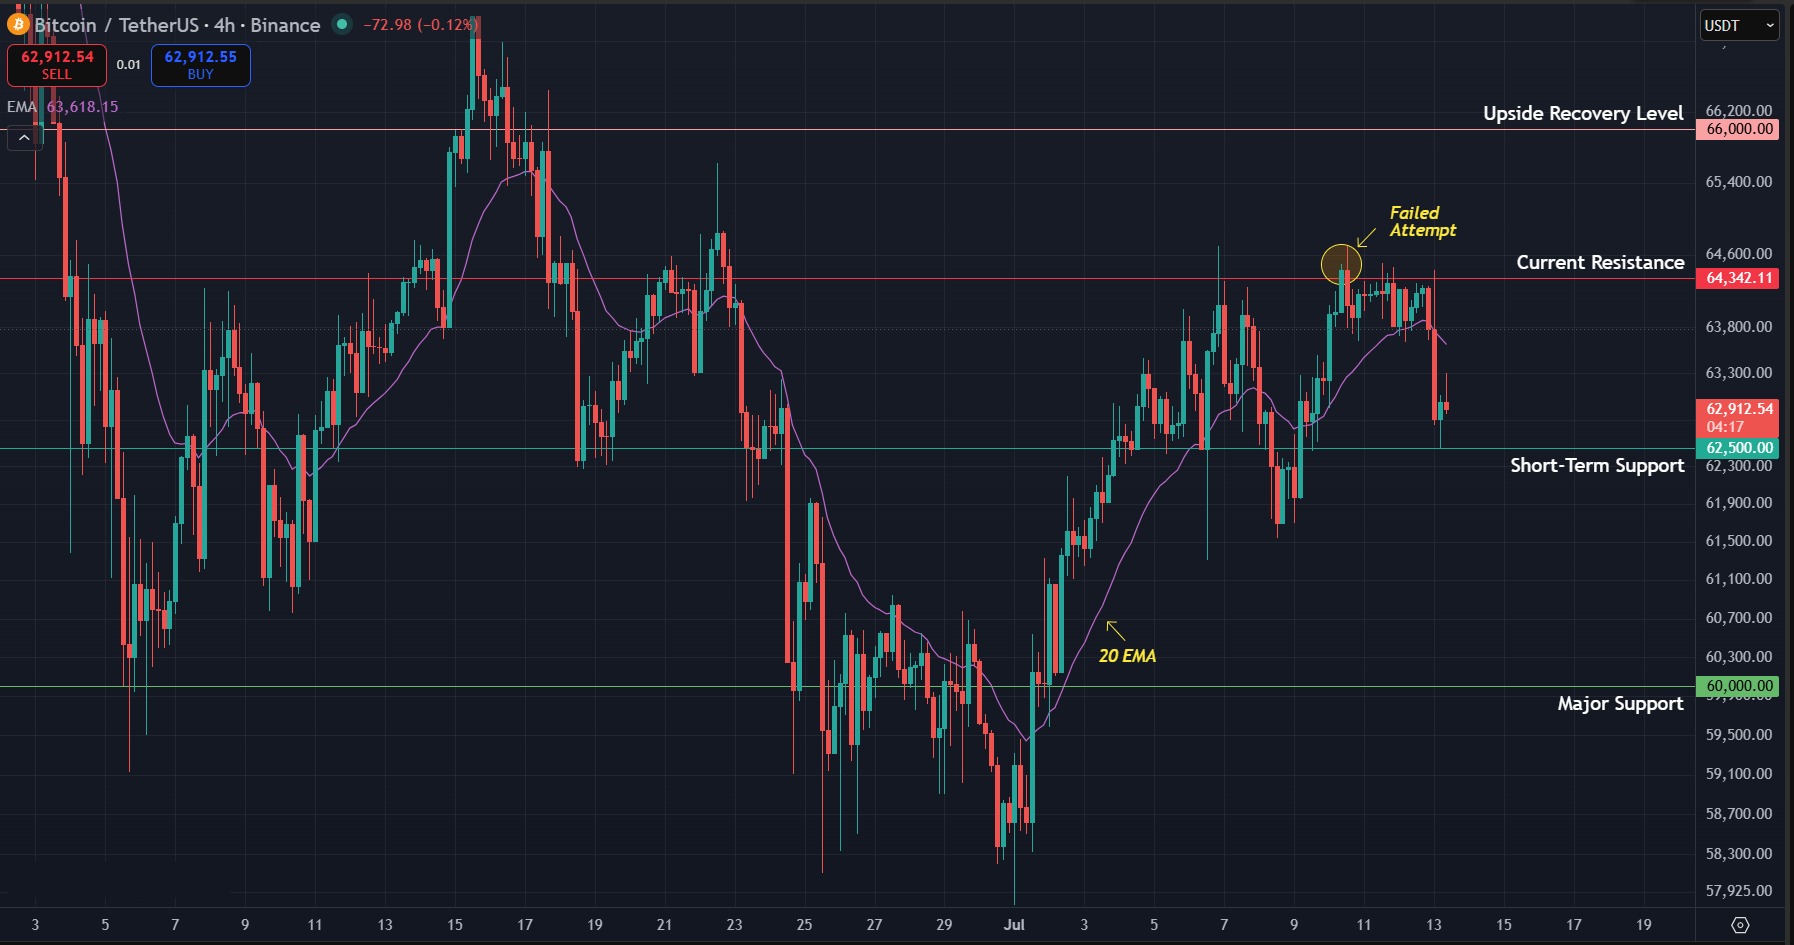
Bitcoin’s 4H chart gives the clearest view of today’s move. The daily chart still matters for the bigger $60,000 support area, but the 4H chart shows the current range more clearly after BTC rejected near $64,300 and pulled back toward $63,000.
The first support to watch is $62,500. This is near the lower end of today’s range and the level buyers need to defend if the short-term recovery is going to stay alive. A 4H close below $62,500 would weaken the setup and put pressure back on $60,000.
The main resistance is $64,300. Bitcoin already reacted near this area today, so buyers need to reclaim it before the chart improves. A clean move above $64,300 would show that BTC has absorbed the oil-driven pressure and is trying to rebuild momentum.
Above $64,300, the next important level is $66,000. This is the stronger recovery level. A move above $66,000 would give buyers a better signal and reduce the risk of another slide toward $60,000.
If BTC loses $62,500, the next major support is $60,000. This level should stay on the chart because it remains the wider line that separates a controlled pullback from a deeper breakdown. A 4H move into $60,000 would not be ideal, but the bigger damage comes if BTC closes below it and fails to recover.
The 20 EMA is useful on the 4H chart. If Bitcoin stays below the 20 EMA while failing at $64,300, momentum remains weak. If BTC moves back above the 20 EMA and clears $64,300, buyers get a cleaner path toward $66,000.
For now, Bitcoin is holding the lower part of its short-term range. The chart is not bullish yet, but it is also not broken while $62,500 holds.
What to Expect Next
- Bullish case: Bitcoin holds $62,500 and pushes back above $64,300. A stronger move above $66,000 would improve the recovery and show that buyers have taken back control.
- Bearish case: BTC loses $62,500 and fails to recover quickly. That would put $60,000 back in focus. A break below $60,000 would turn the setup much weaker.
- Key catalyst: Oil prices, U.S.-Iran headlines and ETF flows remain the main drivers. Strong ETF inflows could help BTC stabilize, while another macro shock could keep pressure on the range.
- Invalidation: A move above $66,000 would weaken the bearish case. A close below $60,000 would confirm a deeper breakdown.
Why is Bitcoin in focus today?
Bitcoin is in focus because it is holding near $63,000 while U.S.-Iran tensions push oil prices higher and keep global markets cautious.
Are Bitcoin ETF flows improving?
ETF flows improved on July 10, with U.S. spot Bitcoin ETFs recording $90.4 million in net inflows, according to Farside Investors. The rebound is still uneven because the previous two sessions saw outflows.
What Bitcoin price level matters now?
The first short-term level is $62,500. Bitcoin needs to hold this area to avoid a move back toward $60,000. On the upside, $64,300 is the first resistance.
Can Bitcoin recover from here?
Bitcoin can recover if buyers defend $62,500 and push price above $64,300. A move above $66,000 would make the recovery stronger.
Get started on WEEX with a simple 40 USDT reward. Deposit 100 USDT, make your trade, and claim the bonus.
Disclaimer: All content on The Moon Show is for informational and educational purposes only. The opinions expressed do not constitute financial advice or recommendations to buy, sell, or trade cryptocurrencies. Trading involves significant risk and may result in substantial losses. Always seek independent financial advice before making investment decisions. The Moon Show is not responsible for any financial losses or decisions made based on the information provided.
Please view the full disclaimer at: https://themoonshow.com/disclaimer

Bitcoin and Ethereum Quarterly Returns 2026: Q1-Q3 Trends and Q4 Outlook
Quarterly returns for Bitcoin (BTC) and Ethereum (ETH) offer a simple way to measure how the tw...

LINK Breaks August High as Chainlink Expands Into Global Payments
LINK is holding above $13 on September 7 after gaining 9.9% in the previous session. The move c...

XRP ETF Inflow Streak Ends After $170M Run. Can Price Hold $1.31?
XRP is trading near $1.36 on September 3 after U.S. spot XRP ETFs recorded their first net outf...