 Price Analysis: Bulls Eye $117,500 But $100,000 Still in Play")
Bitcoin (BTC) Price Analysis: Bulls Eye $117,500 But $100,000 Still in Play
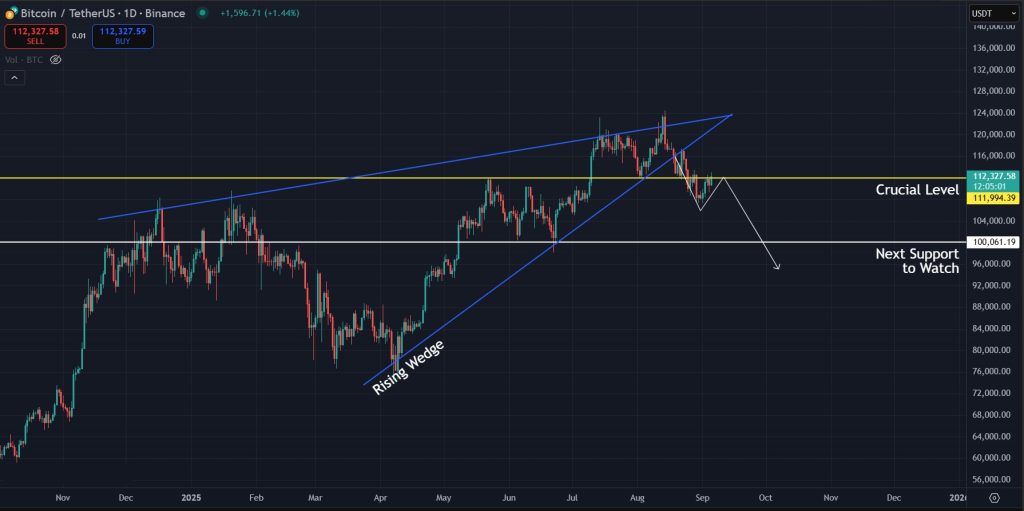
Bitcoin is currently trading just above the $112,000 mark and is finally gaining some bullish momentum on lower timeframes. The price seems to have broken above the resistance at the $112,000 level, and the bulls are trying to push higher once again. However, as mentioned in our previous analysis, the overall trend for BTC remains bearish, and we are not out of the woods yet. Bitcoin needs to reestablish the $112,000 mark as solid support before we can start leaning bullish in the short term. Let's take a quick look at the latest Bitcoin charts to see where the price could be headed in the coming days.
Key Takeaways
- Bitcoin has broken above $112,000 but needs to hold this level as support to confirm short-term strength.
- An inverse head and shoulders on the 4-hour chart signals potential upside toward $117,500.
- The weekly rising wedge still suggests a possible correction back toward $100,000.
Get started on WEEX with a simple 40 USDT reward. Deposit 100 USDT, make your trade, and claim the bonus.
Analyzing the Bitcoin Charts
On the 4-hour chart, Bitcoin is trading slightly above the $112,000 resistance and attempting to flip it into support once again. This move came after a breakout from the falling wedge that BTC had been forming on the 4-hour timeframe. Following the breakout and a clean retest, the price pushed through $112,000. Now, the bulls need to sustain momentum here for the breakout to hold and lead to further upside.
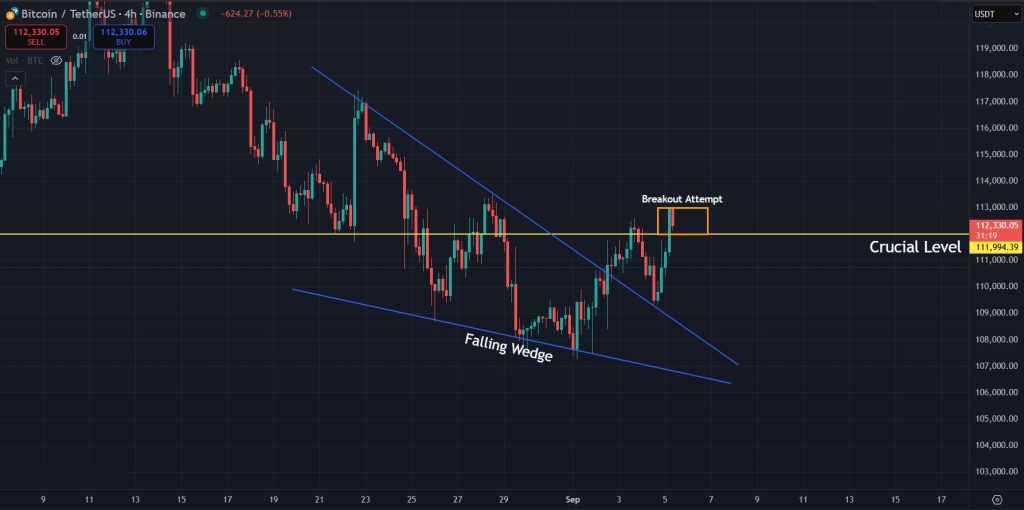
Short-Term Bullish Setup on the 4-Hour Chart
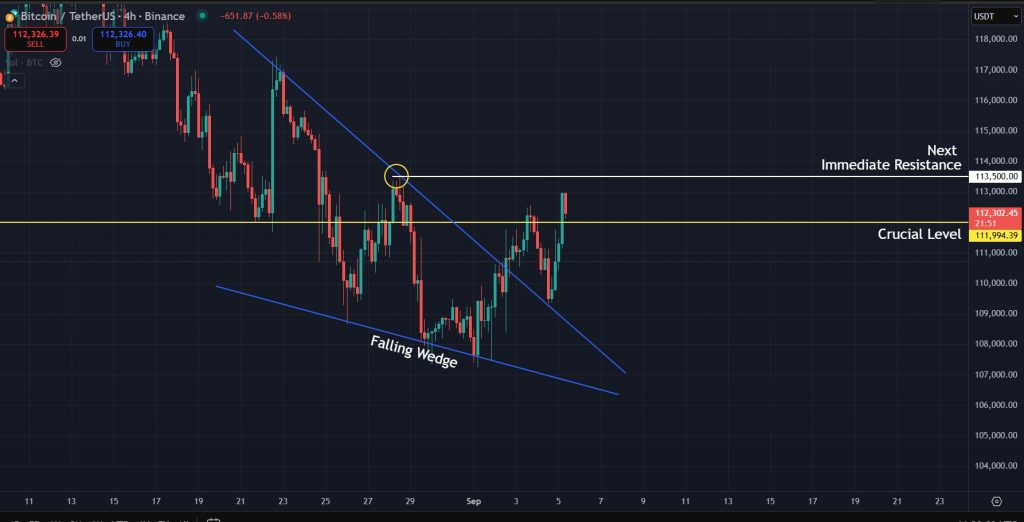
It is vital that the price starts closing daily candles above this level, as it will help bulls maintain momentum. Once the price holds above $112,000, the next level BTC needs to conquer to reverse the trend on micro timeframes is $113,500, as that’s where the previous high was formed.
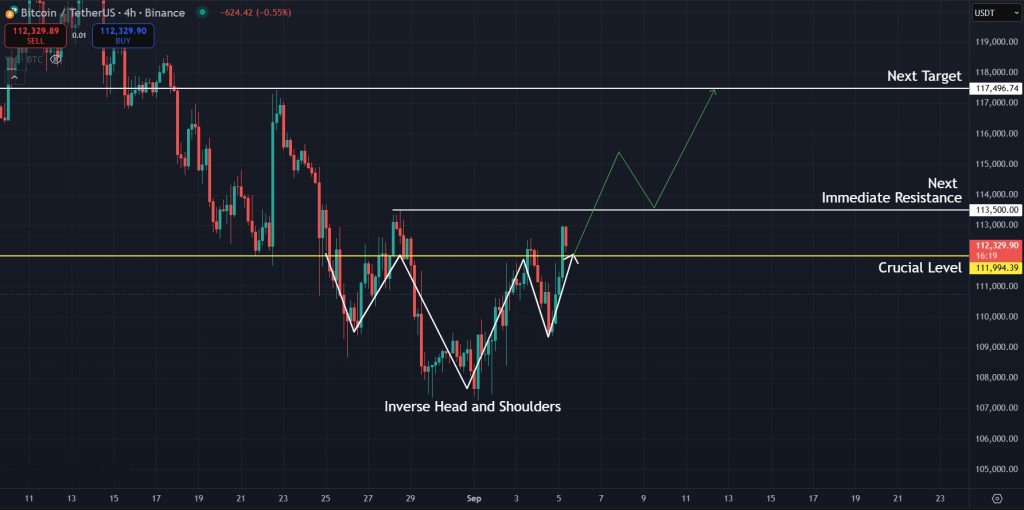
Inverse Head and Shoulders Points Toward $117,500
We also have an inverse head and shoulders pattern forming here, which is another bullish sign. If this pattern were to play out, we would be heading towards $117,500, where the next resistance lies. However, while the 4-hour charts look bullish, the lack of momentum in the overall crypto market still leans toward a bearish Bitcoin price prediction.
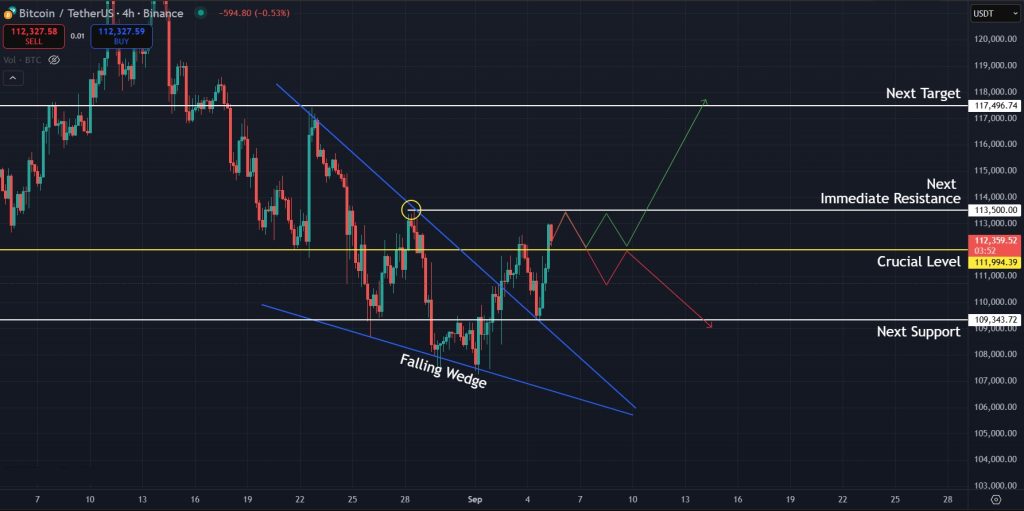
Bearish Scenario if $112,000 Fails to Hold
On the other hand, if the price fails to reestablish $112,000 as support and continues to slowly lose momentum, we could see it drop again, with the next support around $109,000. Another move down to this level would be quite bearish and could point toward further correction, possibly toward the $100,000 zone.
Weekly Rising Wedge Signals Risk of Deeper Correction
Furthermore, there is still a rising wedge pattern playing out on the weekly timeframe, which indicates BTC is undergoing a corrective wave. This structure makes a move toward $100,000 even more likely, and the way price reacts to that level in the coming days or weeks will be important to watch.
Final Takeaway: What is Next for Bitcoin (BTC)?
Bitcoin is currently showing some bullish signs on the 4-hour timeframe, but the overall trend is still leaning bearish. The falling wedge breakout has pushed the price above $112,000 for now, and the inverse head and shoulders pattern also points toward further upside. However, bulls need strong volume here for this short-term breakout to hold. Otherwise, with the rising wedge still playing out on the weekly chart, a move toward $100,000 remains likely in the coming weeks.
Join WEEX and unlock 40 USDT back with your first deposit-and-trade step. Deposit 100 USDT and start trading.
Disclaimer: All content on The Moon Show is for informational and educational purposes only. The opinions expressed do not constitute financial advice or recommendations to buy, sell, or trade cryptocurrencies. Trading involves significant risk and may result in substantial losses. Always seek independent financial advice before making investment decisions. The Moon Show is not responsible for any financial losses or decisions made based on the information provided.
Please view the full disclaimer at: https://themoonshow.com/disclaimer

HYPE Drops Toward $60 As Chip Selloff Hits Crypto
HYPE dropped toward $60 on July 17 as a chip-led selloff pulled risk assets lower. The token fe...

ONDO Surges as DTCC Tokenized Stock Push Brings Wall Street Rails Onchain
ONDO became one of the market’s stronger movers after Ondo launched tokenized stock representat...

Chainlink Tests $8.40 As Mantle’s CCIP Move Puts LINK Back In Focus
Chainlink is getting fresh attention after Mantle moved its $2.5B+ Super Portal from LayerZero ...