 Price Analysis: Descending Triangle Points to Lower Levels")
Ripple (XRP) Price Analysis: Descending Triangle Points to Lower Levels
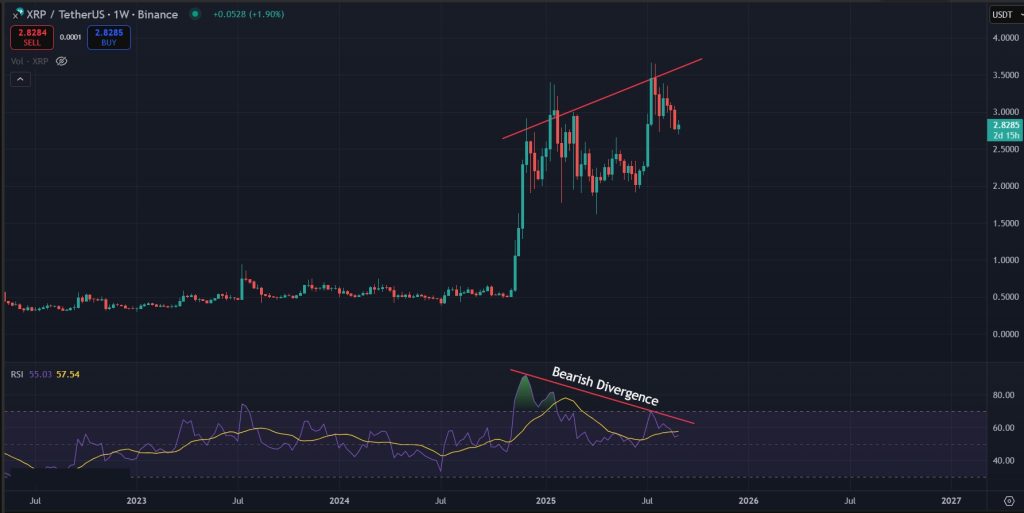
XRP is currently trading around $2.80 and continues to lack momentum on lower timeframes. In our previous analysis, we highlighted a bearish divergence on the weekly timeframe, signaling a potential significant correction in the coming days. With the broader market also losing steam, this downtrend may extend further. Let’s dive into the latest XRP charts to explore where the price could be headed next.
Key Takeaways
- Bearish divergence on the weekly chart signals a likely correction for XRP.
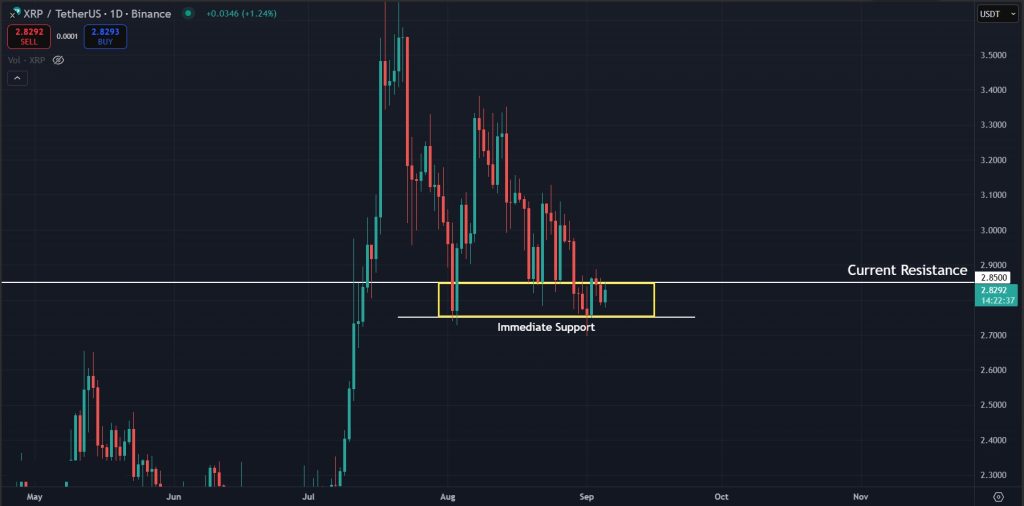
- Price remains trapped between $2.75 support and $2.85 resistance on lower timeframes.
- A break below $2.75 could trigger a retest of lower levels.
Get started on WEEX with a simple 40 USDT reward. Deposit 100 USDT, make your trade, and claim the bonus.
Analyzing the XRP Charts
The first thing to watch for with XRP is the bearish divergence formed on the weekly timeframe. This divergence occurs when the price forms a higher high, but the RSI forms a lower high, signaling weakening momentum. It’s a bearish indicator suggesting that the price is in overbought territory and likely needs to correct before any further upside. This is also why the current XRP price prediction leans bearish.
Consolidation Continues Under $2.85
On the daily timeframe, XRP is currently facing resistance around $2.85 and needs to break above this level to regain momentum. The price is also holding immediate support around $2.75, trapping it in a tight range between these two levels. A breakout from this range will likely drive the price in either direction, though the bias remains bearish.
Next Levels to Watch for XRP
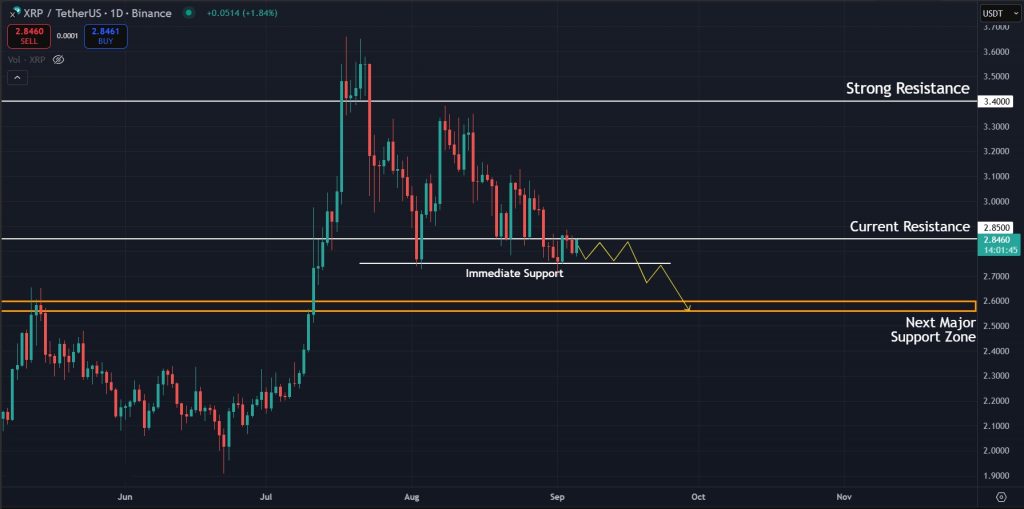
If somehow buyers step in and push XRP above the $2.85 resistance with strong volume in the coming days, the next major hurdle will be around $3.40. However, it is more likely that the price will continue its downtrend this month, with the next key support zone for XRP between $2.56 and $2.59. This zone has acted as strong resistance in the past and will likely hold as support in the coming days.
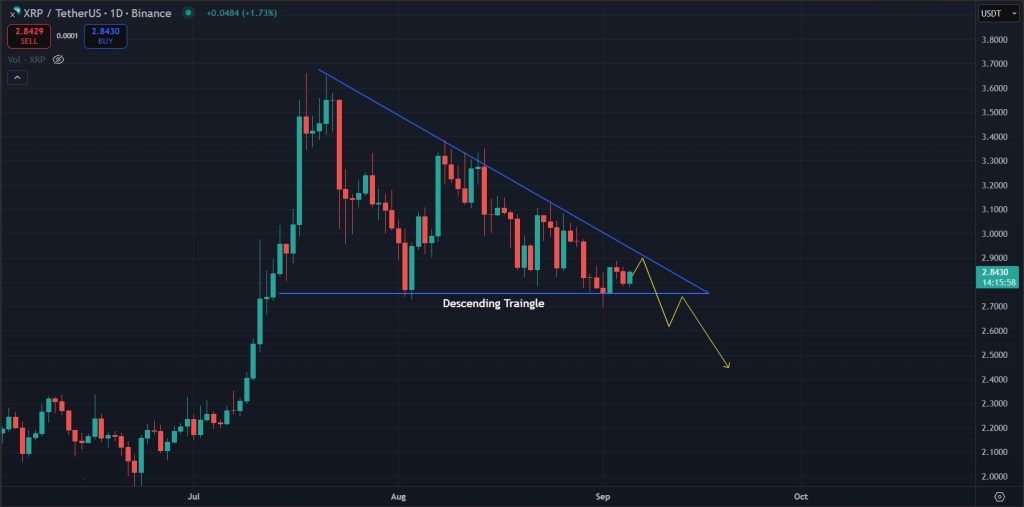
Descending Triangle Points Toward Correction
We also cannot overlook the descending triangle forming on the daily chart, which further points to a potential correction. This bearish pattern typically indicates that bulls are struggling to hold key levels while bears are gaining control. Although the price remains within this structure, a break below it could trigger a retest of the $2.56 support area.
Final Takeaway: What is Next for Ripple (XRP)?
XRP is currently trading below the $2.85 resistance and appears to be in a downtrend on higher timeframes. Both daily and weekly chart indicators point to a potential correction for XRP, which aligns with the broader market’s loss of momentum. If the price breaks below $2.75 in the near term, confirming the descending triangle on the daily chart, XRP could soon test lower levels.
Join WEEX and unlock 40 USDT back with your first deposit-and-trade step. Deposit 100 USDT and start trading.
Disclaimer: All content on The Moon Show is for informational and educational purposes only. The opinions expressed do not constitute financial advice or recommendations to buy, sell, or trade cryptocurrencies. Trading involves significant risk and may result in substantial losses. Always seek independent financial advice before making investment decisions. The Moon Show is not responsible for any financial losses or decisions made based on the information provided.
Please view the full disclaimer at: https://themoonshow.com/disclaimer

HYPE Drops Toward $60 As Chip Selloff Hits Crypto
HYPE dropped toward $60 on July 17 as a chip-led selloff pulled risk assets lower. The token fe...

ONDO Surges as DTCC Tokenized Stock Push Brings Wall Street Rails Onchain
ONDO became one of the market’s stronger movers after Ondo launched tokenized stock representat...

Chainlink Tests $8.40 As Mantle’s CCIP Move Puts LINK Back In Focus
Chainlink is getting fresh attention after Mantle moved its $2.5B+ Super Portal from LayerZero ...