 Price Analysis: September Weakness Keeps BTC Under Pressure")
Bitcoin (BTC) Price Analysis: September Weakness Keeps BTC Under Pressure
Bitcoin is currently trading just below the $110,000 mark and is struggling to gain momentum on lower timeframes. As mentioned in our previous analysis, BTC looks bearish as it has broken below the rising wedge pattern it formed on the weekly timeframe. The price is also trading below the crucial support at $112,000 and could drop further if the bulls do not push in the next few days. Let’s take a quick look at the latest Bitcoin charts to see where the price could be headed next in the short term.
Key Takeaways
- Bitcoin is trading below $112,000 and remains under pressure from sellers.
- A correction toward $100,000 looks likely unless bulls regain momentum soon.
- Multiple bearish indicators suggest September could stay weak for BTC.
Get started on WEEX with a simple 40 USDT reward. Deposit 100 USDT, make your trade, and claim the bonus.
Analyzing the Bitcoin Charts
If we take a look at the latest 4-hour charts for BTC, we can see that the price is moving in a downtrend and trading within a falling channel. The downtrend in a falling channel is usually followed by a breakout, and we can expect the same here for Bitcoin. However, when the price does break out of the channel, it is likely to face resistance at the $112,000 mark, which previously acted as a strong support region for Bitcoin.

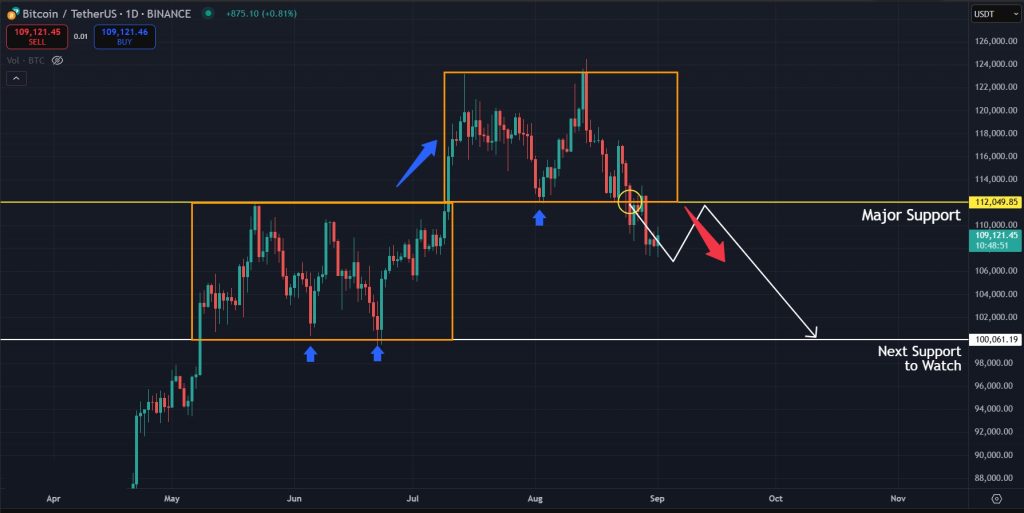
Crucial Support Lost on the Daily Timeframe
Switching to the 1-day timeframe, we can see that the price action was following the same pattern as the previous leg. When BTC broke above $100,000, it consolidated for a while and formed a double-bottom pattern before the next breakout. We can see that the same structure was being followed here, except during the second bottom the sellers gained control, and the price broke below a crucial support level. This does indicate that the bearish Bitcoin price prediction of $100,000 is still likely.
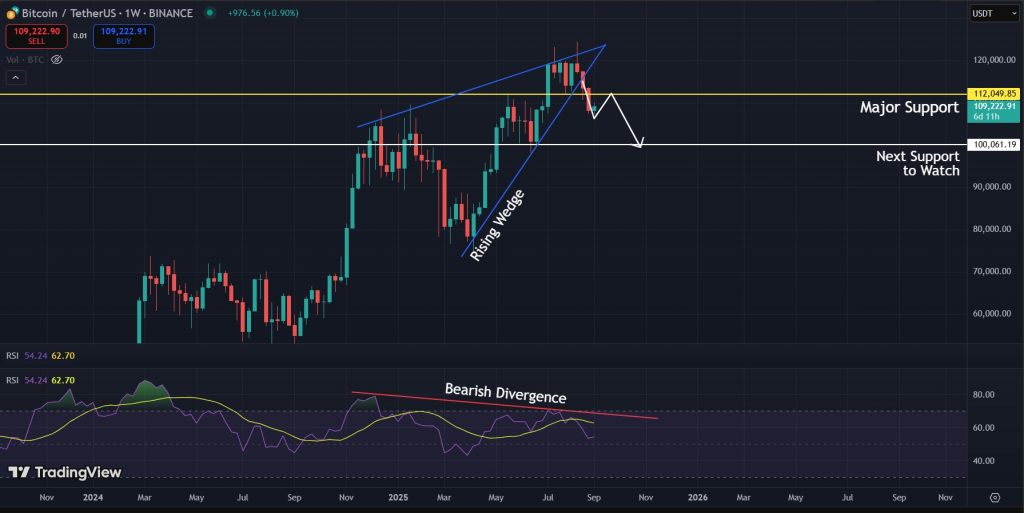
Bearish Divergence on the Weekly Timeframe
Furthermore, if we move on to the 1-week timeframe, we have multiple indicators that also point toward more bearishness. We still have the rising wedge pattern we have been discussing over the past couple of weeks. The price has broken below it and will likely move in a downtrend in the coming weeks. We also see a bearish divergence, where the higher high formed by this rising wedge pattern is contradicted by a lower high on the RSI. All this suggests that Bitcoin is heading into a correction, and this could turn out to be a bearish month for BTC.
Final Takeaway: What is Next for Bitcoin (BTC)?
Bitcoin is currently struggling to gain momentum and is trading below the crucial support level of $112,000. Right now, things are not looking good for the bulls as sellers are in control and multiple indicators point towards a correction. At the moment, we are looking at the $100,000 mark, but things could change if Bitcoin consolidates here and volume starts to pick up. September is historically a bearish month for the crypto market, so a correction here would not really surprise most traders.
Start trading on WEEX with a 100 USDT deposit and unlock 40 USDT back after completing your first trading step.
Disclaimer: All content on The Moon Show is for informational and educational purposes only. The opinions expressed do not constitute financial advice or recommendations to buy, sell, or trade cryptocurrencies. Trading involves significant risk and may result in substantial losses. Always seek independent financial advice before making investment decisions. The Moon Show is not responsible for any financial losses or decisions made based on the information provided.
Please view the full disclaimer at: https://themoonshow.com/disclaimer

HYPE Drops Toward $60 As Chip Selloff Hits Crypto
HYPE dropped toward $60 on July 17 as a chip-led selloff pulled risk assets lower. The token fe...

ONDO Surges as DTCC Tokenized Stock Push Brings Wall Street Rails Onchain
ONDO became one of the market’s stronger movers after Ondo launched tokenized stock representat...

Chainlink Tests $8.40 As Mantle’s CCIP Move Puts LINK Back In Focus
Chainlink is getting fresh attention after Mantle moved its $2.5B+ Super Portal from LayerZero ...