 Price Analysis: Market Sentiment Shifts Bearish After Whale Sell-Off")
Bitcoin (BTC) Price Analysis: Market Sentiment Shifts Bearish After Whale Sell-Off
Bitcoin fell below $111,000 in a sudden weekend flash crash after a whale unloaded 24,000 BTC into thin liquidity. The entire balance was moved to Hyperunite, with 12,000 BTC transferred on Sunday alone. This heavy selling erased the gains that followed Fed Chair Jerome Powell’s speech on Friday and triggered a wave of forced liquidations across the market. The price action now reflects clear bearish momentum, with sellers holding the upper hand. To understand what comes next, it is important to look at the charts and see which levels could guide Bitcoin’s direction.
Key Takeaways:
- Bitcoin is trading in a downward channel on lower timeframes, showing short-term bearish momentum.
- The daily and weekly breakdowns point to a likely retest of $105,000 support, with risk of dropping below $100,000.
Analyzing the Charts
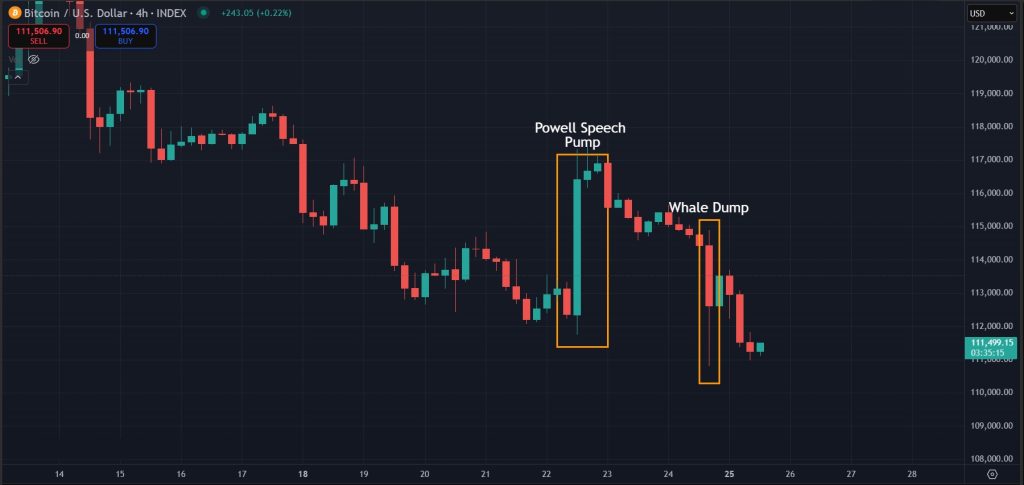
On the 4-hour chart, Bitcoin shows a clear price boost on Friday, marked by a strong green candle that followed Fed Chair Jerome Powell’s speech. The chart also highlights the sharp drop caused by the whale’s BTC sell-off on Sunday, which left a long wick to the downside. These two events have pulled market sentiment in opposite directions over the past three days.
Lower-Highs on the 4-hour Timeframe
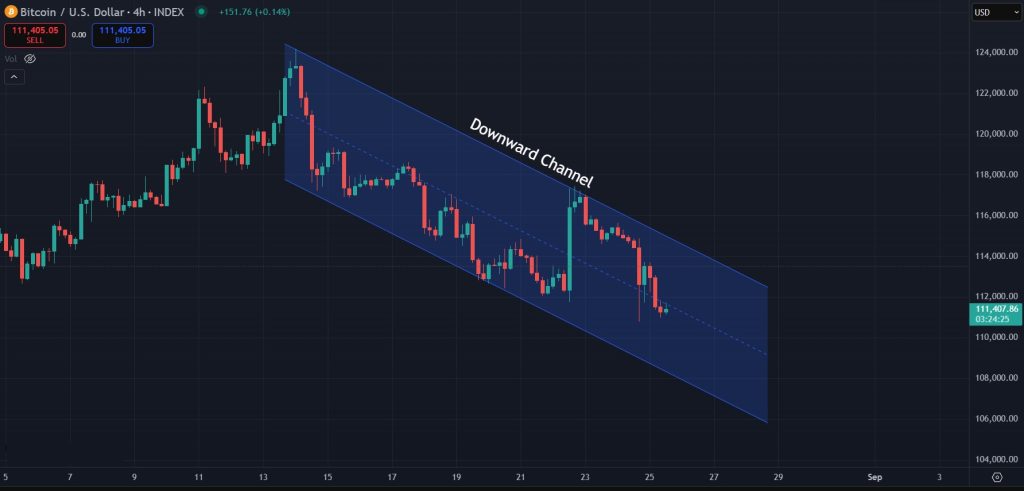
The 4-hour chart also shows Bitcoin trading within a downward channel, with price repeatedly failing to break above resistance. This pattern points to further downside in the short term, as Bitcoin continues to form lower highs. Still, it is worth noting that a downward channel is often seen as a bullish structure, since price tends to break to the upside once resistance is overcome.
Rising Channel on the Daily Chart Suggests Further Downside
When we zoom out to the daily chart, Bitcoin has slipped below the rising channel that guided its recent uptrend. After breaking down, price attempted to climb back inside the channel but was rejected at resistance. This rejection is a strong signal that the trend has shifted and Bitcoin could head lower from here. The next key level sits around $105,500, which may act as support if the decline continues. This daily breakdown also weakens the bullish case for a breakout on the 4-hour downward channel, suggesting the short-term downtrend might extend further, in line with the current Bitcoin price prediction.

Rising Wedge on the Weekly Chart Playing Out
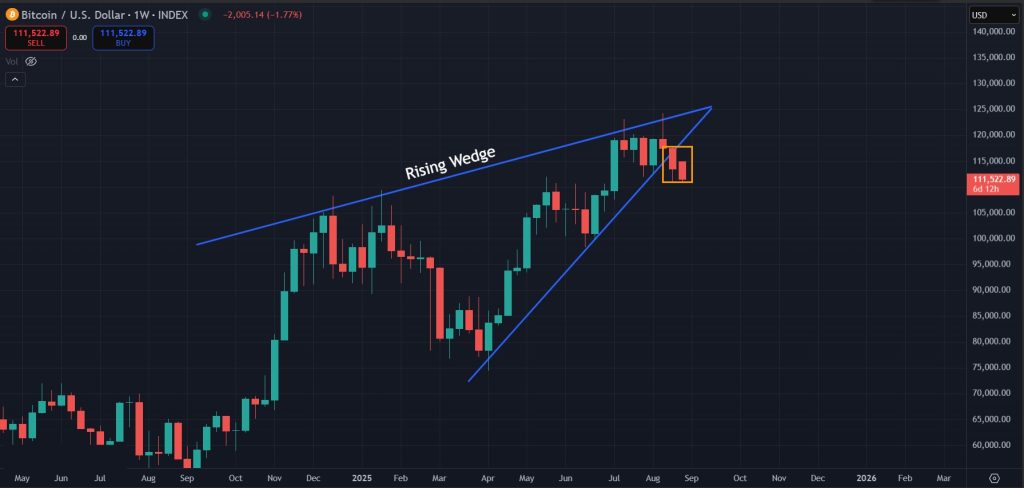
As noted in our previous analysis, Bitcoin has also broken below the rising wedge pattern on the weekly chart, and that breakdown is now unfolding. This makes a retest of the $105,000 level highly likely. With such a major trend shift, there is also a real possibility that the price could fall below $100,000 if bearish momentum strengthens. On the other hand, if bulls manage to defend support this week and push price higher, another retest of the $120,000 zone remains possible.
Final Takeaway: What is Next for Bitcoin (BTC)?
Bitcoin is under pressure across multiple timeframes. On the 4-hour chart, the price is stuck in a downward channel and continues to form lower highs. The daily chart adds to this bearish outlook, with Bitcoin breaking below the rising channel and rejecting it on the retest. On the weekly timeframe, the breakdown from the rising wedge is still in play, making a retest of the $105,000 support level very likely. If this support fails, Bitcoin could slide even lower, with a move below $100,000 becoming possible as the broader market turns bearish.
Get started on WEEX with a simple 40 USDT reward. Deposit 100 USDT, make your trade, and claim the bonus.
Disclaimer: All content on The Moon Show is for informational and educational purposes only. The opinions expressed do not constitute financial advice or recommendations to buy, sell, or trade cryptocurrencies. Trading involves significant risk and may result in substantial losses. Always seek independent financial advice before making investment decisions. The Moon Show is not responsible for any financial losses or decisions made based on the information provided.
Please view the full disclaimer at: https://themoonshow.com/disclaimer

HYPE Drops Toward $60 As Chip Selloff Hits Crypto
HYPE dropped toward $60 on July 17 as a chip-led selloff pulled risk assets lower. The token fe...

ONDO Surges as DTCC Tokenized Stock Push Brings Wall Street Rails Onchain
ONDO became one of the market’s stronger movers after Ondo launched tokenized stock representat...

Chainlink Tests $8.40 As Mantle’s CCIP Move Puts LINK Back In Focus
Chainlink is getting fresh attention after Mantle moved its $2.5B+ Super Portal from LayerZero ...