 Price Analysis: Descending Triangle and Bearish Divergence Signal Caution")
Ethereum (ETH) Price Analysis: Descending Triangle and Bearish Divergence Signal Caution
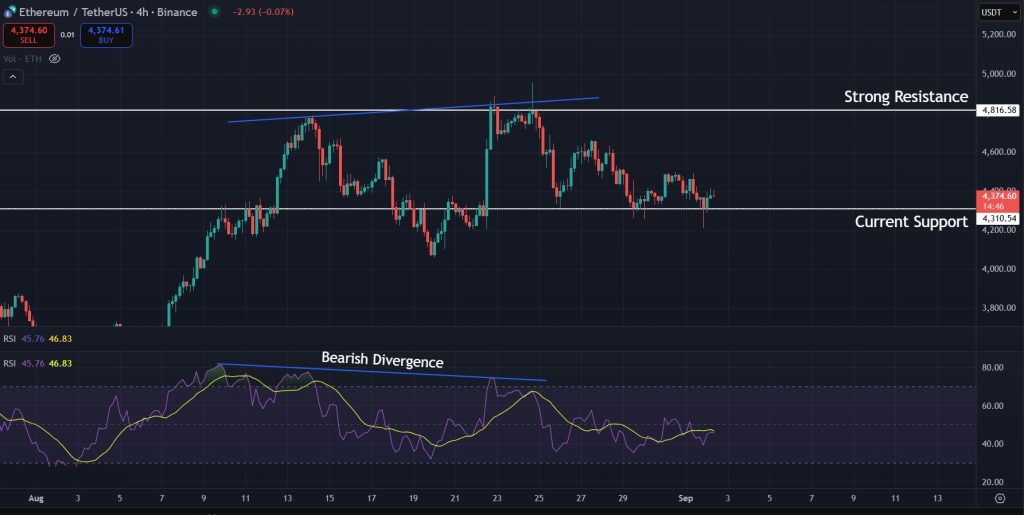
Ethereum is currently trading around the $4,400 mark and is still consolidating on the lower timeframes. As highlighted in our previous analysis, the bearish divergence on the 4-hour timeframe does indicate a short-term downtrend, but overall ETH looks neutral and the $3,900 support is likely to hold in the coming days. We have seen Ethereum do well over the past few weeks with Bitcoin dominance dropping, however, if the broader market trend continues to remain bearish, a correction for ETH will come sooner rather than later. Let’s take a look at the latest Ethereum price charts to see where the price could be headed next in the short term.
Key Takeaways
- Ethereum is consolidating around $4,400 with $3,900 acting as a key support.
- A descending triangle on the 4H chart signals potential downside if $4,300 breaks.
- Weekly bearish divergence points toward further correction in the coming weeks.
Get started on WEEX with a simple 40 USDT reward. Deposit 100 USDT, make your trade, and claim the bonus.
Analyzing the Ethereum Charts
If we take a look at the latest 4-hour charts for ETH, we can see that the price is holding support at $4,300 despite the bearish divergence and is trying to bounce from it once again to gain momentum.
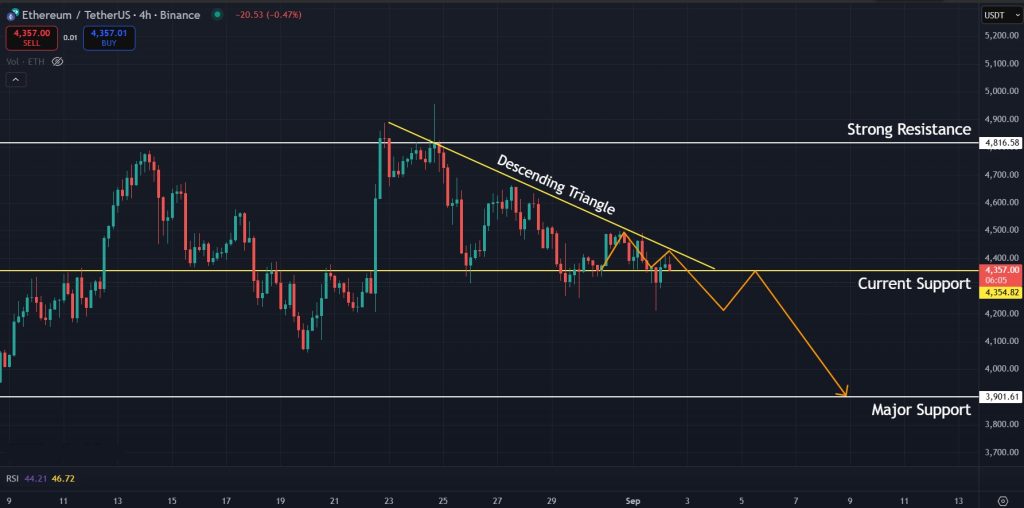
However, it can also be noted that the price is forming a descending triangle, which is a bearish pattern. Once the price breaks below the support at $4,300, we can expect a signifcant drop, and the support level to watch in that scenario is the major support for ETH just above the $3,900 level. This is the level where bulls can step in and defend.
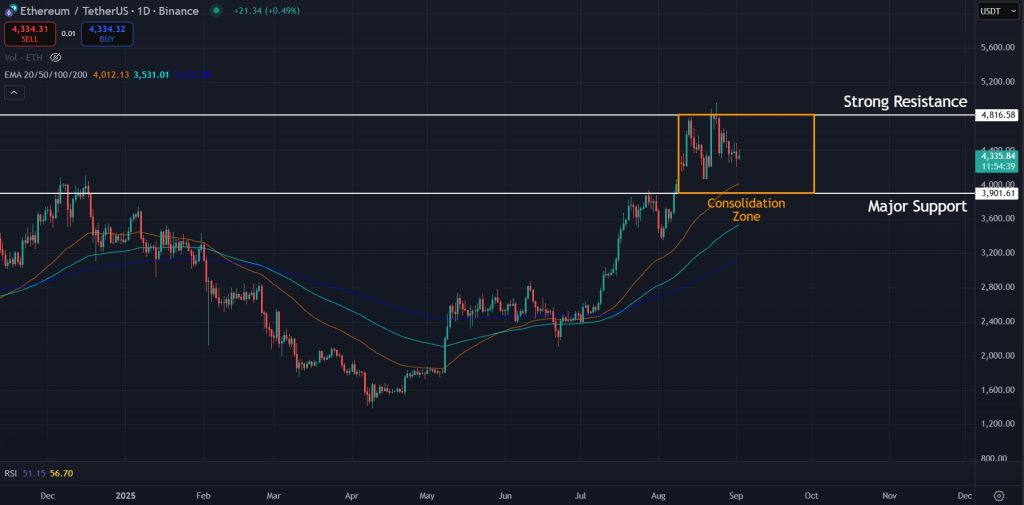
Switching to the 1-day timeframe, we can see that the price is still trading above all exponential moving averages, and with how things have looked so far for ETH, it is likely that we will see some consolidation here before Ethereum makes its next move to either side.
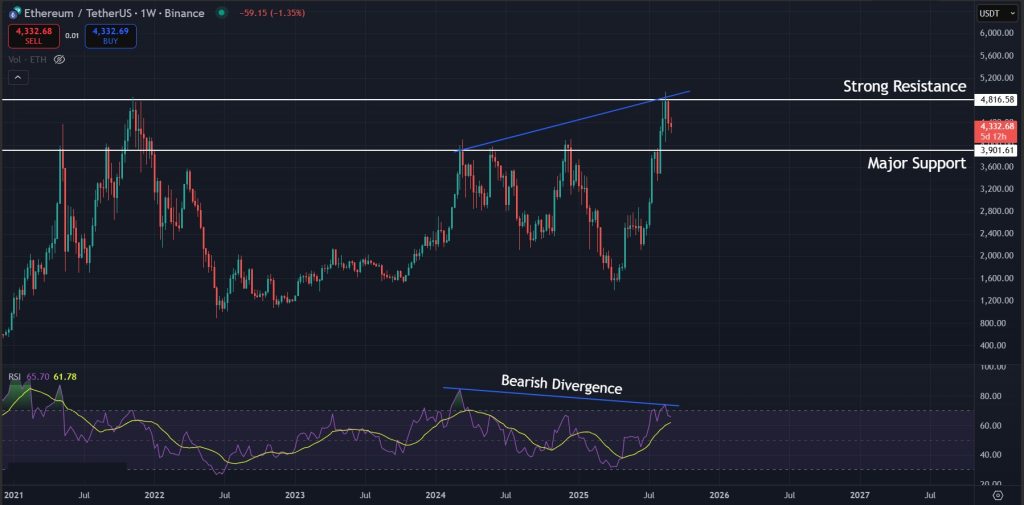
Lastly, if we take a look at the bigger picture for Ethereum by zooming out to the 1-week chart, we can find another big bearish divergence here which indicates more correction in the coming weeks. While consolidation is more likely at the moment, in the mid-term we can expect ETH to drop further.
Final Takeaway: What is Next for Ethereum (ETH)?
Ethereum is currently losing steam, and a retest of the $3,900 support seems likely. Overall, Ethereum looks neutral at the moment, with sideways movement expected in the short term before any major move in price. However, with the broader market trend leaning toward a downtrend and the bearish divergence on the 1-week timeframe, Ethereum will likely face further correction in the coming weeks.
Start trading on WEEX with a 100 USDT deposit and unlock 40 USDT back after completing your first trading step.
Disclaimer: All content on The Moon Show is for informational and educational purposes only. The opinions expressed do not constitute financial advice or recommendations to buy, sell, or trade cryptocurrencies. Trading involves significant risk and may result in substantial losses. Always seek independent financial advice before making investment decisions. The Moon Show is not responsible for any financial losses or decisions made based on the information provided.
Please view the full disclaimer at: https://themoonshow.com/disclaimer

HYPE Drops Toward $60 As Chip Selloff Hits Crypto
HYPE dropped toward $60 on July 17 as a chip-led selloff pulled risk assets lower. The token fe...

ONDO Surges as DTCC Tokenized Stock Push Brings Wall Street Rails Onchain
ONDO became one of the market’s stronger movers after Ondo launched tokenized stock representat...

Chainlink Tests $8.40 As Mantle’s CCIP Move Puts LINK Back In Focus
Chainlink is getting fresh attention after Mantle moved its $2.5B+ Super Portal from LayerZero ...