


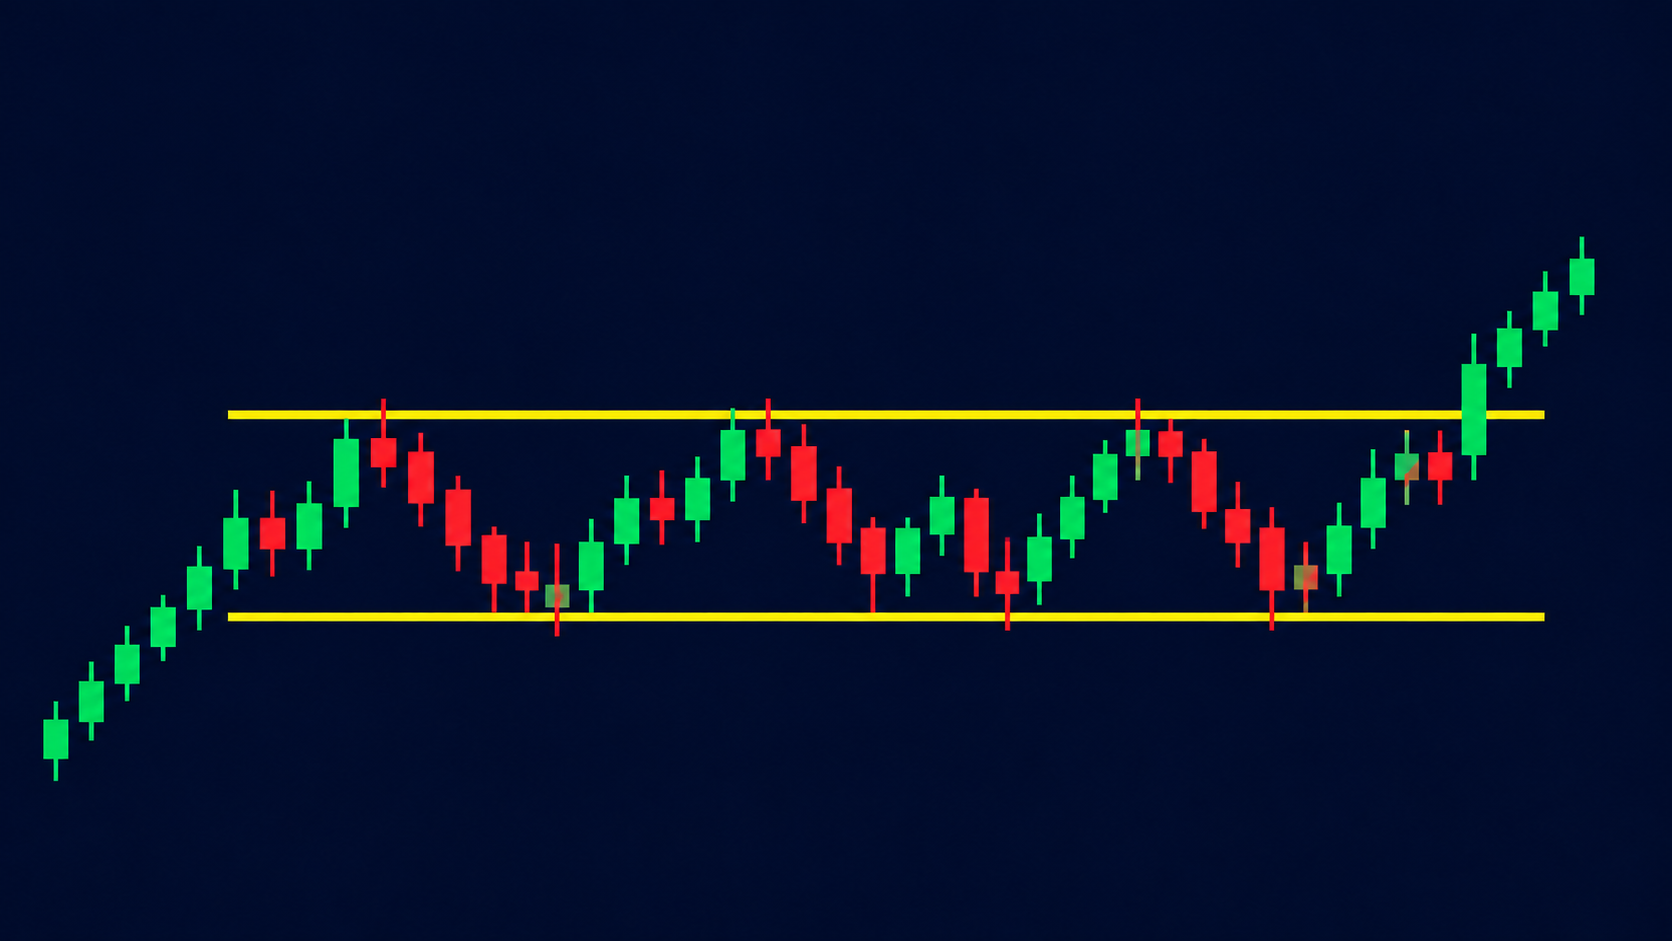
Quick Summary: A rectangle pattern forms when a cryptocurrency trades sideways between support and resistance. Traders watch for a break beyond either boundary, then use the range to plan an entry, stop-loss, and potential target. A breakout can fail, even when volume rises, or a retest holds.
A rectangle pattern, also known as a rectangle chart pattern, represents price movement between two levels. It shows that the market often pauses before initiating a major price move.
This guide explains what a rectangle pattern is, how to identify it, and how to trade it.
What is a rectangle pattern?
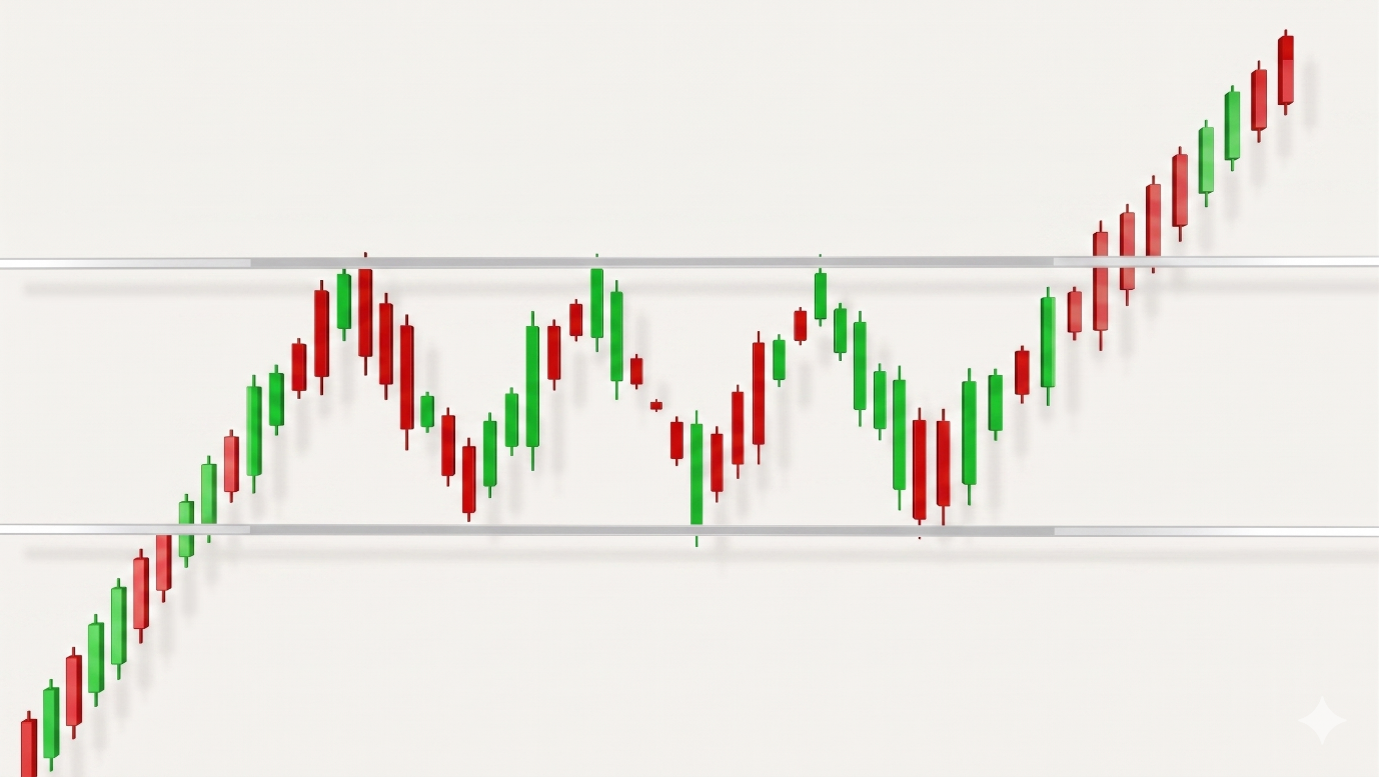
A rectangle pattern forms when the price of a cryptocurrency moves horizontally between two parallel lines, resistance and support. The price oscillates between these lines and creates a rectangular shape on the chart.
Support is the lower area where buying has previously slowed a decline. Resistance is the upper area where selling has previously slowed an advance.
The pattern shows that price has remained within a range for a period, and it does not prove that buyers and sellers are equally strong. A breakout above resistance can suggest renewed buying, while a breakout below support can suggest growing selling pressure. But either move can reverse.
Your $30,000 bonus + 10% discount are waiting on Bybit! Sign up and claim these rewards before they’re gone. Time’s ticking!
Components of a rectangle pattern
The rectangle pattern consists of three main components:
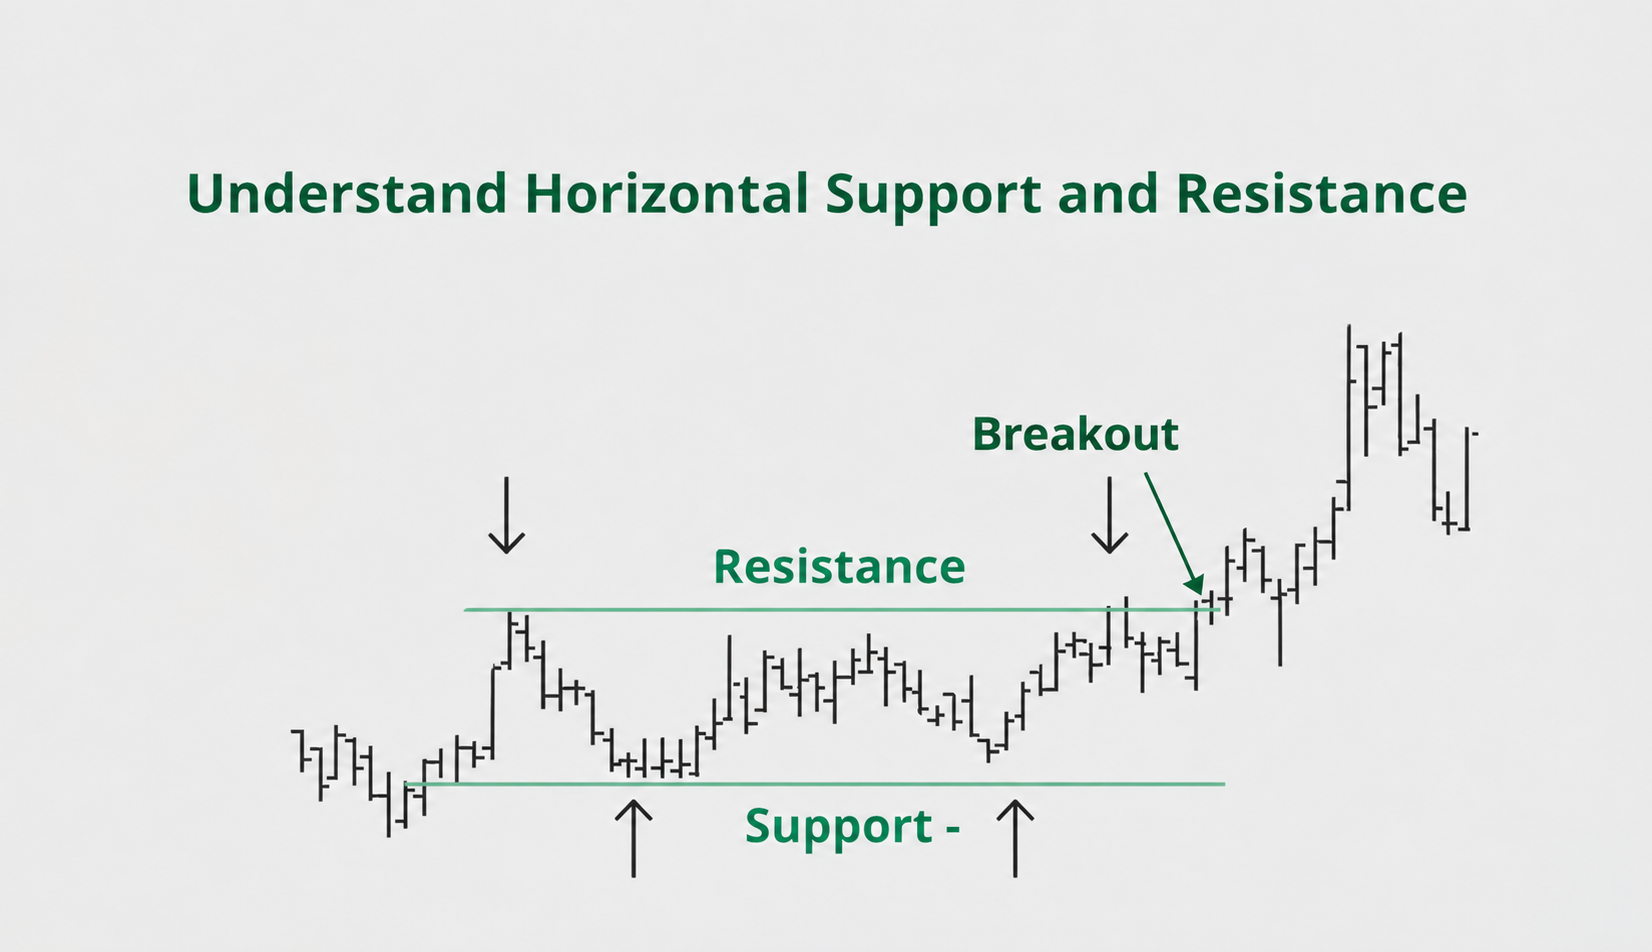
- Upper or resistance line: This is a horizontal line acting as a resistance level and connects the highs of the price movement within the rectangle. Here, the price faces difficulty in breaking through to the upside.
- Lower or support line: This horizontal line acts as a support level and connects the lows of the price movement within the rectangle. Here, the price faces difficulty in breaking through to the downside.
- Breakout: A breakout happens when the price finally moves outside the rectangle, either pushing above the upper resistance line (a bullish breakout) or dropping below the lower support line (a bearish breakout). Traders consider this a signal that the price will likely continue trending in the same direction.
Important Read: Head and shoulders pattern: crypto trading rules and risks
How to identify a rectangle pattern
To identify a rectangle pattern:
- Look for two parallel horizontal lines marking support at the bottom and resistance at the top.
- Each line should connect at least two price lows (troughs) and two price highs (peaks), creating a sideways trading range.
- The price tends to bounce between these levels without forming significant higher highs or lower lows, resembling a rectangle shape.
Types of rectangle patterns
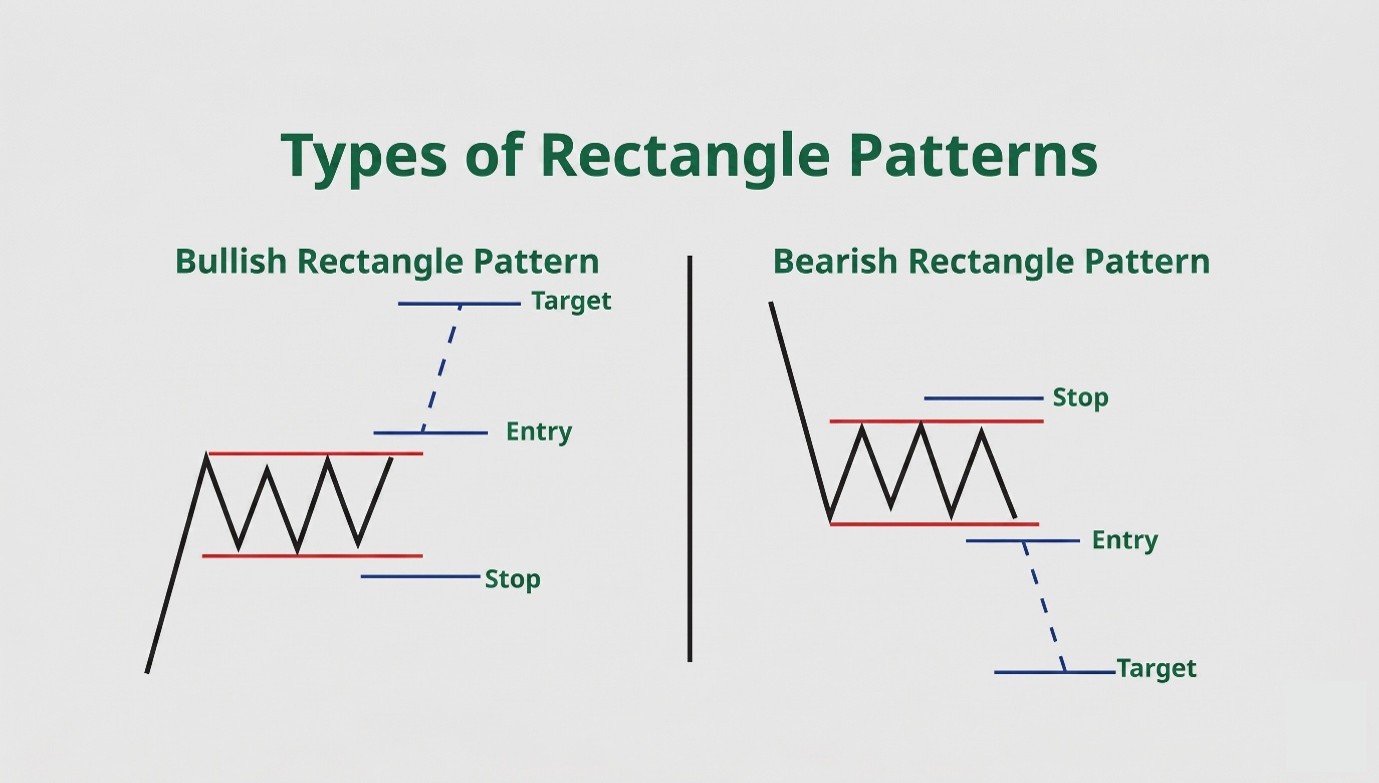
The two primary types of rectangle patterns are the bullish rectangle pattern and the bearish rectangle pattern.
A bullish rectangle develops after an advance, when price moves sideways before breaking above resistance. A bearish rectangle forms after a decline, when price ranges before breaking below support. In both cases, the breakout happens after the range forms.
The earlier trend provides context, not a promise. Price can break against it, turning the range into a possible reversal rather than a continuation.
Until a boundary breaks, the direction remains uncertain. Unlike a bull flag or bear flag, a rectangle has roughly horizontal boundaries.
What does the rectangle pattern signal?
A rectangle pattern can signal the following:
- When the price breaks out to the upside resistance level, it is considered a bullish signal. Traders may enter a long position, expecting that the price will continue moving higher.
- If the price breaks below the support level, it is considered a bearish signal. Traders may enter a short position, expecting the price to continue moving downward.
- The pattern can also mark reversals at major structural levels, such as after a prolonged trend when volume declines into the range. It does not guarantee an edge.
Remember, as the cryptocurrency market is highly volatile, fake breakouts often happen. The bias described here is based on general pattern tendencies and is not guaranteed.
Indicators and confirmation
Traders can use additional technical indicators to increase the reliability of the rectangle pattern:
- Volume: An increase in trading volume during the breakout helps confirm the strength of the breakout. High volume suggests strong market participation, which increases the likelihood that the trend will hold rather than quickly reverse.
- Moving averages: Traders may also use moving averages to confirm the breakout. For instance, if the price breaks above the resistance line and is also above a key moving average, such as the 50-day or 200-day, this can provide additional information about a bullish breakout.
How to trade a rectangle breakout
The following is a simple step-by-step guide to trading a rectangle pattern:
Spot the rectangle
Identify the pattern with two clear tops and bottoms, which shows consolidation between support and resistance levels.
The breakout
Mark the range and decide what will count as a breakout. One approach is to wait for a candle to close above resistance for a potential long position, or below support for a potential short position. A wick alone does not satisfy this rule, although a close outside the range can still fail.
Entry
Enter a position after confirming the breakout. Some traders wait for a breakout retest to confirm strength.
Profit target
Set the profit target at a distance matching the width of the price channel from the breakout level.
Stop-loss
For a long position, one approach is to place the stop-loss below the broken resistance, and for a short position, it is above the broken support. A wider stop beyond the opposite side of the range is another choice, but it requires a smaller position to keep the same planned dollar risk.
Remember, false breakouts are common in crypto trading, so carefully place your stop-loss and wait for confirmation before opening a position.
Rectangle pattern trading example
Suppose you are trading BTC/USDT on a four-hour chart, and Bitcoin (BTC) forms a rectangle with support at $58,000 and resistance at $60,000. This is a hypothetical example, and not a historical trade.
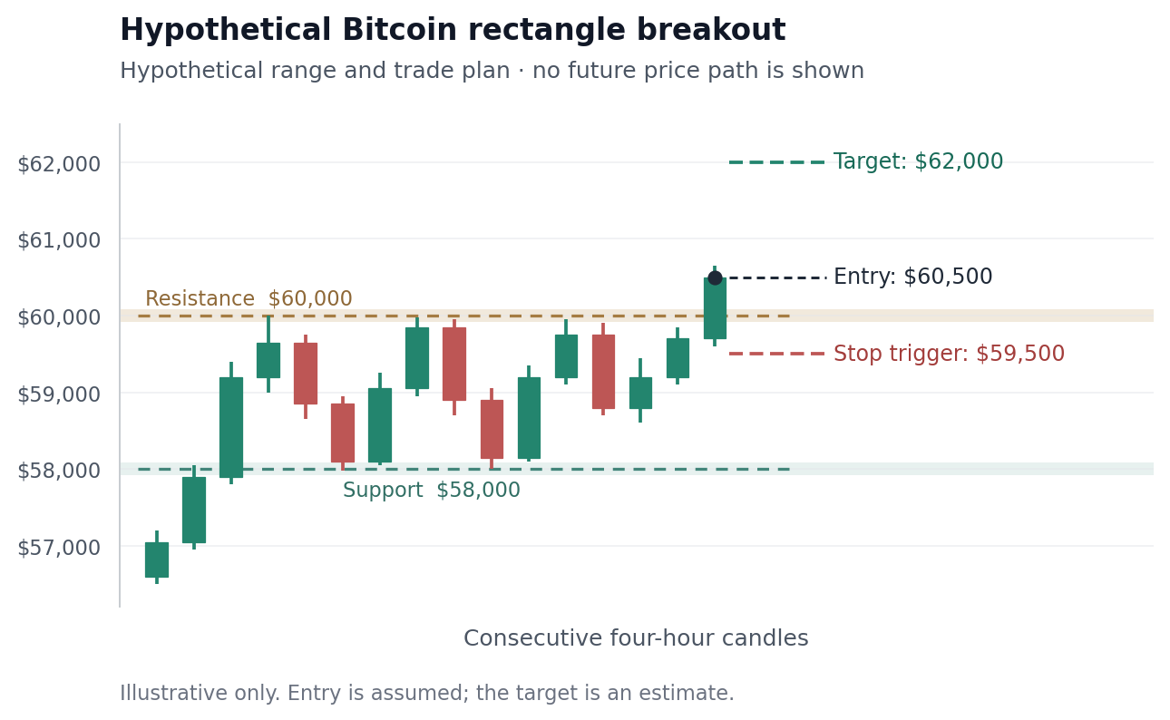
Suppose a four-hour candle closes above resistance and a trader enters a spot long at an assumed fill of $60,500, with a stop at $59,500. The range is $2,000 high ($60,000 − $58,000). Following the measured-move method described by Fidelity, adding that height to resistance gives an estimated target of $62,000. It is a reference point, not a guarantee.
The planned risk is $1,000 per BTC, while the potential reward to the target is $1,500 per BTC, or a 1:1.5 risk-to-reward ratio before costs. If a trader has a $10,000 account and chooses to risk $100, the calculated position is 0.1 BTC ($100 ÷ $1,000). Buying it at $60,500 costs $6,050 without leverage. Fees, slippage, and actual fills can change the result.
For a short position, the same method subtracts $2,000 range height from $58,000, giving a hypothetical target of $56,000. Opening a short position generally involves borrowing or a derivatives product, as selling a crypto you already own is not the same as opening a short position. Moreover, leverage adds liquidation risk.
Important Read: Understanding the Double Bottom Pattern in Crypto Trading
When the rectangle range pattern fails
A rectangle range pattern fails when the price moves outside the range but returns inside instead of sustaining the move. It can happen after a candle close, a volume increase, or a retest.
A return inside warns that the breakout is weakening. The exact exit depends on the trader’s predefined plan and order settings.
A stop-loss helps manage risk but does not guarantee the intended exit price. A stop-market order can fill at a worse price during volatility, while a stop-limit order may not fill at all.
Use a position size that accounts for these risks, and avoid treating any pattern as a certain outcome.
Final thoughts
A rectangle range pattern provides traders a way to organize a sideways market around support and resistance. The useful part is the plan: define the breakout rule, invalidation level, position size, and estimated target before opening a position, and be prepared for the setup to fail.
FAQs
Is a rectangle pattern bullish or bearish?
It is a neutral pattern where price remains in the range. A break above resistance is a bullish signal and a break below support is bearish, but either can fail.
How many touches are needed for a rectangle pattern?
A common guideline for the pattern is two touches of support and two of resistance, but this does not guarantee reliability.
Does a rectangle breakout need a retest?
No. The price may continue without a retest, and even one that holds can be followed by a failed breakout.
How do you calculate a rectangle pattern target?
Subtract support from resistance to find the range height. Add that height to resistance after an upside breakout, or subtract it from support after a downside break.
What is the success rate of a rectangle pattern?
There is no universal success rate. Estimates depend on the market, timeframe, entry and exit rules, and the sample tested.
Sign up on WEEX and roll for a chance to win a share of the $1,000,000 prize pool.