 Price Analysis: Momentum Fades as Correction Risks Grow")
Ripple (XRP) Price Analysis: Momentum Fades as Correction Risks Grow
XRP is currently trading around the $2.81 mark and appears to be in a downtrend on lower timeframes. The past couple of months have been excellent for XRP, with the price making significant gains and surging after finding strong support near the $2.00 region. However, the extraordinary bullish momentum XRP gained recently seems to be fading, and a correction appears imminent. Let's take a quick look at the latest XRP charts to see where the price could be headed next in the short term.
Key Takeaways
- XRP is trading below key support at $2.85, signaling potential further downside toward $2.55-$2.60 if bearish momentum continues.
- A descending triangle on the daily chart suggests XRP could break lower unless it holds above $2.75 in the near term.
- Bearish divergence on the weekly timeframe indicates XRP is overbought, pointing to a likely correction or consolidation soon.
Get started on WEEX with a simple 40 USDT reward. Deposit 100 USDT, make your trade, and claim the bonus.
Analyzing the XRP Charts
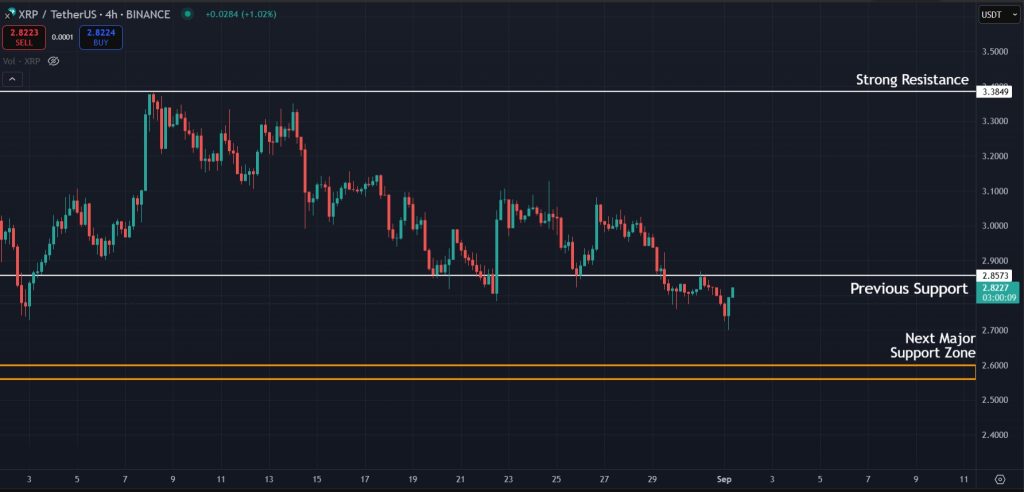
If we take a look at the latest 4-hour charts for XRP, the first thing we notice is that the price is now trading below the $2.85 mark, which is an important level of support. At the moment, the price is only slightly below it. However, if the price rejects this level and establishes it as new resistance, we will likely see further downside for XRP in the immediate short term. If that happens the next major support we will be eyeing is the zone between the $2.55 and $2.60.
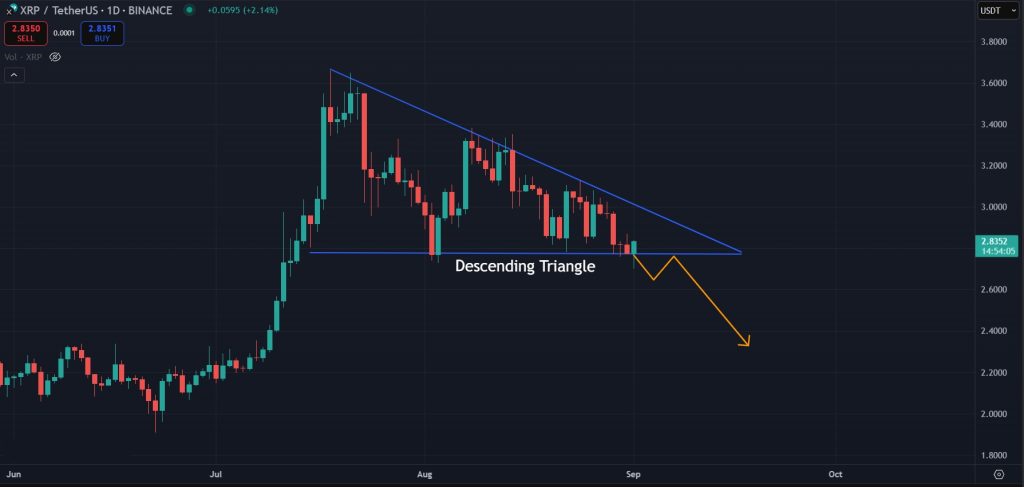
Descending Triangle on the 1-Day Timeframe
Now, if we zoom out to the 1-Day timeframe, we can clearly see the price being squeezed within a descending triangle pattern, which is a bearish indicator. XRP is currently losing momentum, and with a correction due, it is likely that the price will break below this structure and test lower levels. The price must stay above $2.75 in the next few days to avoid this scenario.
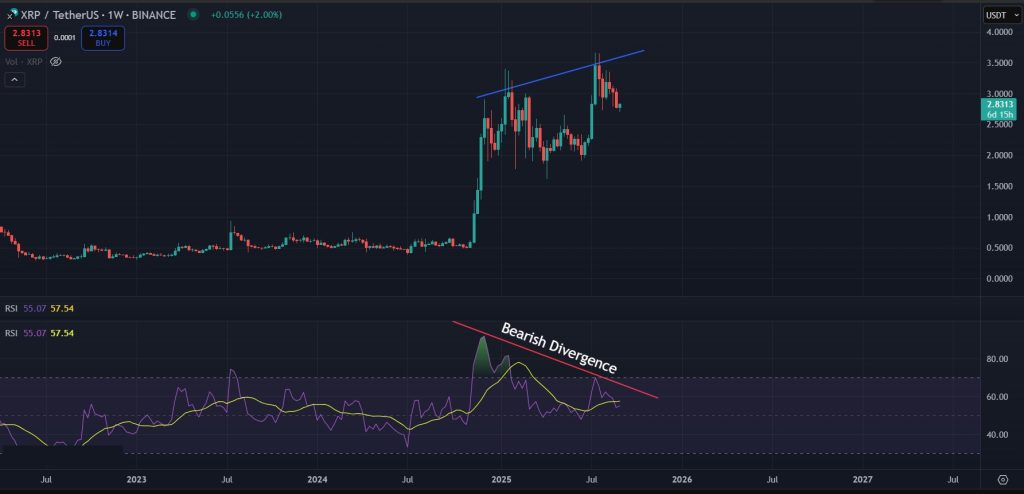
Bearish Divergence Hints Overbought Territory
Another major sign that hints at an XRP correction is the massive bearish divergence visible on the 1-week timeframe. It clearly shows that the price is in overbought territory, and a correction is highly likely. Also, with the broader market trend struggling to gain momentum, it is likely that XRP will face either a correction or a prolonged consolidation phase in the coming weeks.
Final Takeaway: What is Next for Ripple (XRP)?
XRP has enjoyed a strong run in recent months, but signs across multiple timeframes point toward cooling momentum. With the descending triangle on the daily chart, bearish divergence on the weekly, and key support levels now being tested, the risk of a short-term correction is clear. Unless XRP can hold above $2.75 and reclaim lost levels, traders should prepare for further downside or a period of consolidation before the next decisive move.
Join WEEX and unlock 40 USDT back with your first deposit-and-trade step. Deposit 100 USDT and start trading.
Disclaimer: All content on The Moon Show is for informational and educational purposes only. The opinions expressed do not constitute financial advice or recommendations to buy, sell, or trade cryptocurrencies. Trading involves significant risk and may result in substantial losses. Always seek independent financial advice before making investment decisions. The Moon Show is not responsible for any financial losses or decisions made based on the information provided.
Please view the full disclaimer at: https://themoonshow.com/disclaimer

HYPE Drops Toward $60 As Chip Selloff Hits Crypto
HYPE dropped toward $60 on July 17 as a chip-led selloff pulled risk assets lower. The token fe...

ONDO Surges as DTCC Tokenized Stock Push Brings Wall Street Rails Onchain
ONDO became one of the market’s stronger movers after Ondo launched tokenized stock representat...

Chainlink Tests $8.40 As Mantle’s CCIP Move Puts LINK Back In Focus
Chainlink is getting fresh attention after Mantle moved its $2.5B+ Super Portal from LayerZero ...