 Price Analysis: Trendline Retest in Focus as Bulls Defend Key Support")
Sui (SUI) Price Analysis: Trendline Retest in Focus as Bulls Defend Key Support
SUI is currently trading near $3.70 and showing mild weakness on the lower timeframes. The 4-hour and intraday charts point to a short-term pullback, suggesting the asset is cooling off after a recent rally. This dip appears to be a retest of the trendline resistance SUI broke above just a few days ago, rather than a full reversal. Despite this local correction, the broader structure remains bullish. With altcoin momentum picking up, SUI still holds potential for higher levels. Here's a closer look at the latest charts and what they signal for the days ahead.
Start trading on WEEX with a 100 USDT deposit and unlock 40 USDT back after completing your first trading step.
Analyzing the Charts
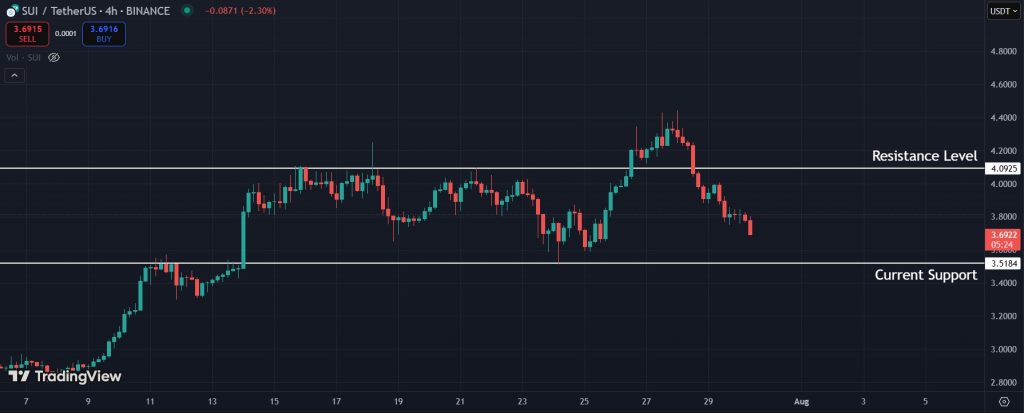
The latest 4-hour chart shows SUI pulling back after failing to hold above the $4.09 level, which has now turned into resistance once again. The $3.51 zone stands out as a key support level that has previously acted as both support and resistance. If the price manages to drop to this area, it could hold and trigger a bounce, especially if buyers step in with volume.
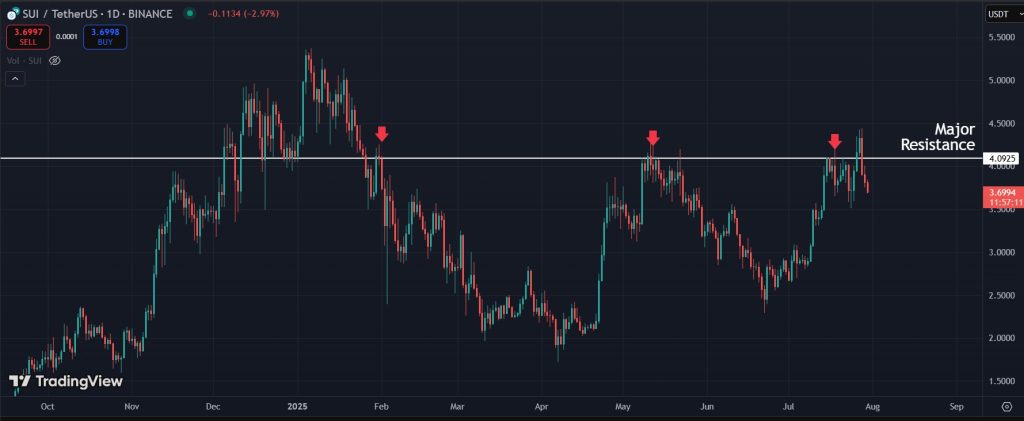
Switching to the 1-day timeframe, the $4.09 area stands out as a major resistance level that has capped SUI’s upside since February. While the price briefly broke above it a few days ago, the move lacked strong follow-through. SUI has since dropped back below this level, and buyers will now need to reclaim it convincingly to regain momentum.
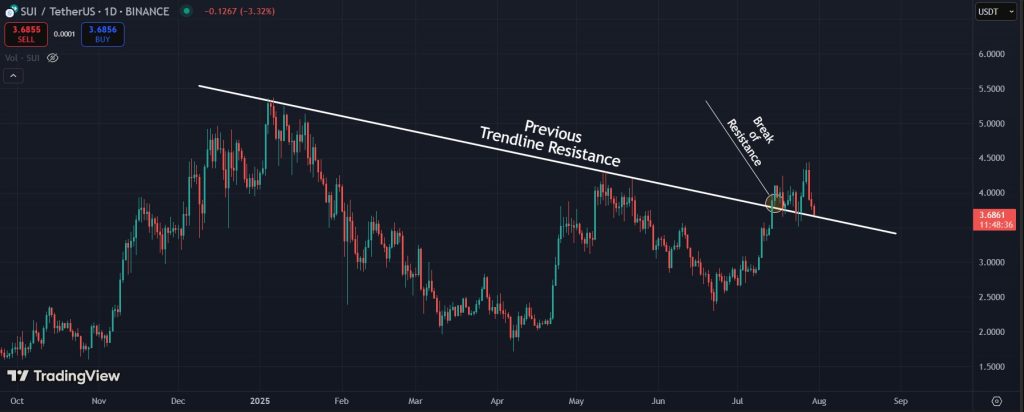
However, there’s another resistance level that SUI broke above a couple of weeks ago and still remains above. This downward slanting trendline had been keeping the price in check by consistently pushing lower highs on the daily chart. The breakout signaled a shift in sentiment, and SUI has managed to hold above this level since then.
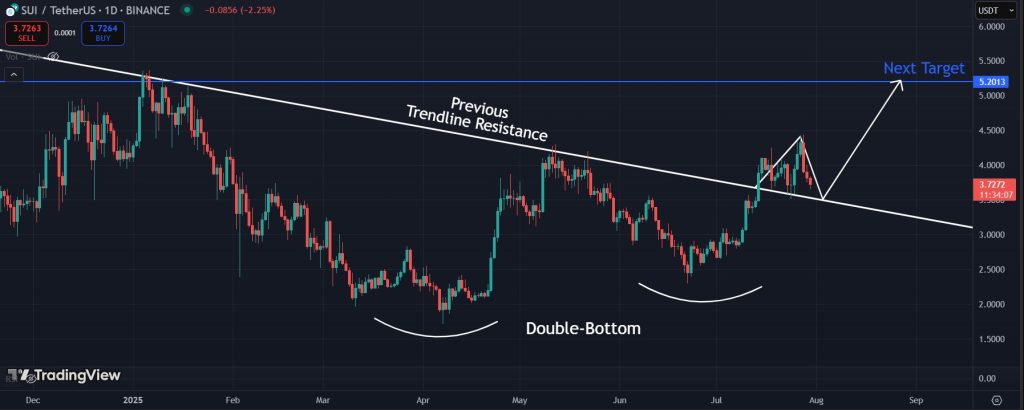
SUI now appears to be retesting the broken trendline to confirm it as a new support level. This kind of retest is common after a significant breakout, where the price pulls back to validate former resistance before continuing higher. The move also aligns with a potential double-bottom pattern visible on the chart. If the retest holds and buyers step in, the pattern could play out fully, with $5.20 as the first upside target.
Final Takeaway: What is Next for Sui (SUI)?
SUI is currently showing some weakness on the lower timeframes but is still holding above a key trendline it recently broke. The price may continue to correct slightly, but as long as it stays above this trendline, the structure remains bullish. The $4.09 level is still acting as a major resistance, and a break above it would likely open the way toward higher targets like $5.20. For now, the broader SUI price prediction remains optimistic, with the uptrend still intact on higher timeframes.
Join WEEX and unlock 40 USDT back with your first deposit-and-trade step. Deposit 100 USDT and start trading.
Disclaimer: All content on The Moon Show is for informational and educational purposes only. The opinions expressed do not constitute financial advice or recommendations to buy, sell, or trade cryptocurrencies. Trading involves significant risk and may result in substantial losses. Always seek independent financial advice before making investment decisions. The Moon Show is not responsible for any financial losses or decisions made based on the information provided.
Please view the full disclaimer at: https://themoonshow.com/disclaimer

HYPE Drops Toward $60 As Chip Selloff Hits Crypto
HYPE dropped toward $60 on July 17 as a chip-led selloff pulled risk assets lower. The token fe...

ONDO Surges as DTCC Tokenized Stock Push Brings Wall Street Rails Onchain
ONDO became one of the market’s stronger movers after Ondo launched tokenized stock representat...

Chainlink Tests $8.40 As Mantle’s CCIP Move Puts LINK Back In Focus
Chainlink is getting fresh attention after Mantle moved its $2.5B+ Super Portal from LayerZero ...