 Price Analysis (Jul 29, 2025): Range-Bound but Macro Structure Still Bullish")
Bitcoin (BTC) Price Analysis (Jul 29, 2025): Range-Bound but Macro Structure Still Bullish
Bitcoin is currently hovering around $118,500, showing little movement on lower timeframes. This sideways price action has persisted for weeks, with no clear breakouts. However, the broader trend still leans bullish! As noted in previous updates, Bitcoin's macro structure remains intact, and the ongoing consolidation could be a pause before the next leg up. With altcoins gaining attention, Bitcoin might stay range-bound for a little while, but the larger pattern still favors upward continuation. Let’s break down the latest charts to see what could come next.
Join WEEX and verify your account to claim a 10–100 USDT coupon. Fund your account to access deposit bonuses and ongoing trading rewards.
Analyzing the Charts
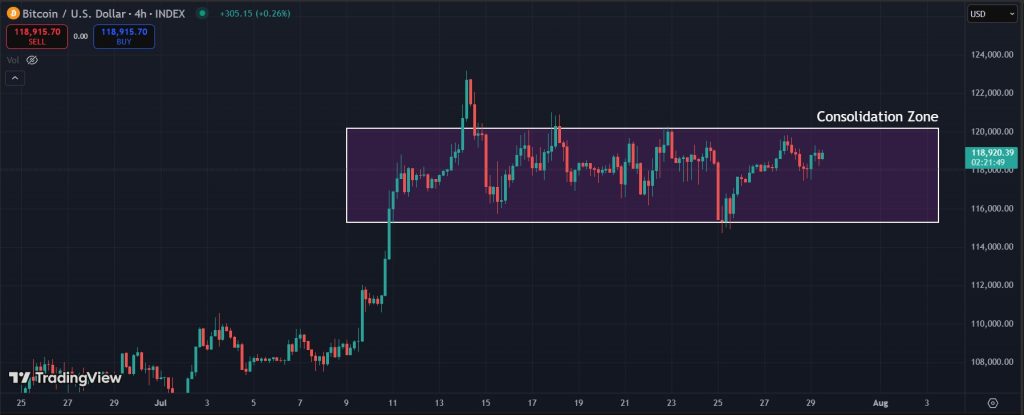
The 4-hour chart shows Bitcoin trading within a defined range, consolidating since the breakout nearly 20 days ago. Price is repeatedly rejecting near the $120,000 resistance, while support around $115,500 continues to hold firm. This range has now become a key zone, and a breakout on either side could dictate the next major move.
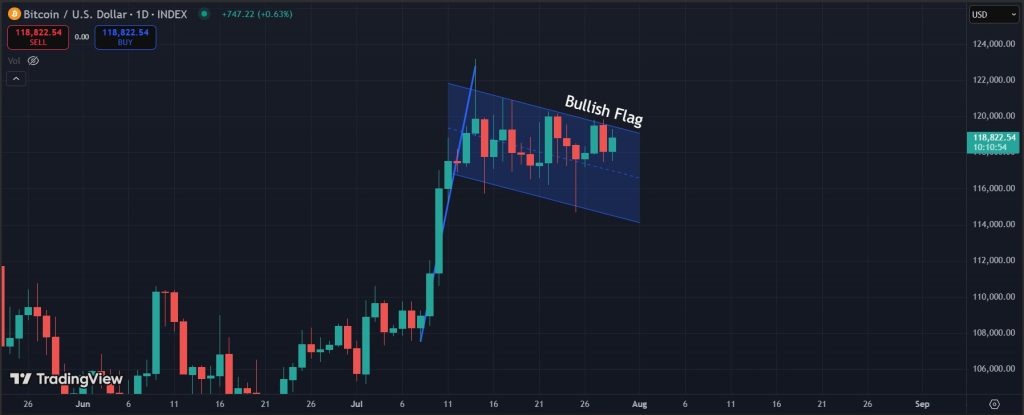
Focusing on the 1-day timeframe, a potential bull flag pattern is forming, which adds to the bullish case for Bitcoin. If this structure breaks to the upside, it could trigger the next rally, with price targets once again stretching above $130,000. However, if the pattern fails to play out, a short-term correction might follow. Even then, the third impulsive wave remains likely. Any delay or breakdown in this setup could stem from increased capital rotation into altcoins.
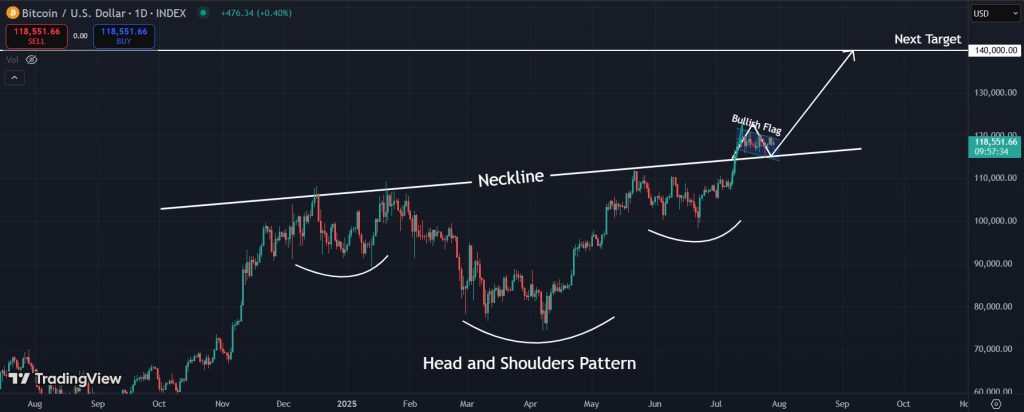
On the daily timeframe, Bitcoin recently broke out of a prominent inverse head and shoulders pattern but has yet to fully reach its projected target. Last week’s minor correction brought the price back to retest the neckline, which held as support. A strong bounce from this level could trigger a sharp move upward, with the $140,000 region as our main target.
Final Takeaway: What is Next for Bitcoin (BTC)?
Bitcoin is trading around $118,500 and moving sideways between strong support at $115,500 and resistance at $120,000. On the higher timeframes, a bull flag is taking shape, and the inverse head and shoulders pattern is still in play. Both structures support a bullish Bitcoin price prediction in the near term. If price breaks out, we could see a move toward $130,000 and possibly $140,000. While a short-term pullback can’t be ruled out, the broader trend remains bullish.
Register on WEEX and verify your identity to earn up to 100 USDT. Deposit funds and participate in trading to access further rewards.
Disclaimer: All content on The Moon Show is for informational and educational purposes only. The opinions expressed do not constitute financial advice or recommendations to buy, sell, or trade cryptocurrencies. Trading involves significant risk and may result in substantial losses. Always seek independent financial advice before making investment decisions. The Moon Show is not responsible for any financial losses or decisions made based on the information provided.
Please view the full disclaimer at: https://themoonshow.com/disclaimer

HYPE Drops Toward $60 As Chip Selloff Hits Crypto
HYPE dropped toward $60 on July 17 as a chip-led selloff pulled risk assets lower. The token fe...

ONDO Surges as DTCC Tokenized Stock Push Brings Wall Street Rails Onchain
ONDO became one of the market’s stronger movers after Ondo launched tokenized stock representat...

Chainlink Tests $8.40 As Mantle’s CCIP Move Puts LINK Back In Focus
Chainlink is getting fresh attention after Mantle moved its $2.5B+ Super Portal from LayerZero ...