 Price Analysis: Key Trendline Break Signals Higher Targets")
Ripple XRP (XRP) Price Analysis: Key Trendline Break Signals Higher Targets
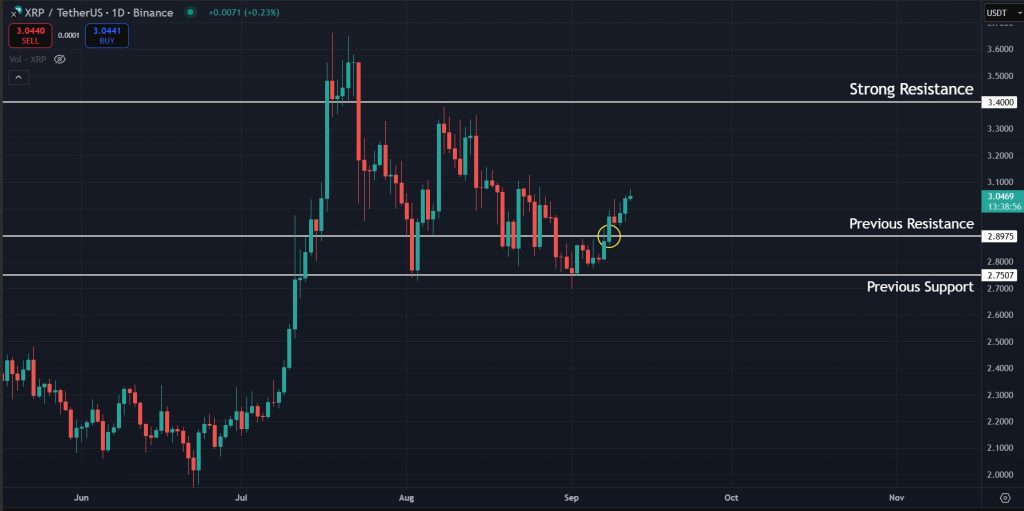
XRP is currently hovering around the $3.00 mark and has once again started to look bullish in the short term. As highlighted in our previous analysis, XRP was facing resistance between the $2.85 and $2.90 mark, and the price has now broken above it. Right now, XRP is gaining strong momentum, and a crucial bearish structure we were eyeing previously has also been invalidated. Let’s take a quick look at the latest price charts for XRP to see where the price could be headed in the coming days.
Key Takeaways
- XRP has broken above the $2.90 resistance and invalidated the descending triangle pattern, turning short-term momentum bullish.
- Key upside targets now sit around $3.40 and $3.80 if momentum continues.
- A bearish divergence on the weekly chart still lingers, signaling caution despite the bullish outlook.
Get started on WEEX with a simple 40 USDT reward. Deposit 100 USDT, make your trade, and claim the bonus.
Analyzing the XRP Charts
If we take a quick look at the 1-day charts for XRP, we can see that the price has broken above the resistance at $2.90 and is now looking bullish. The price traded below this level for over a week but has now gained enough steam to get above it.
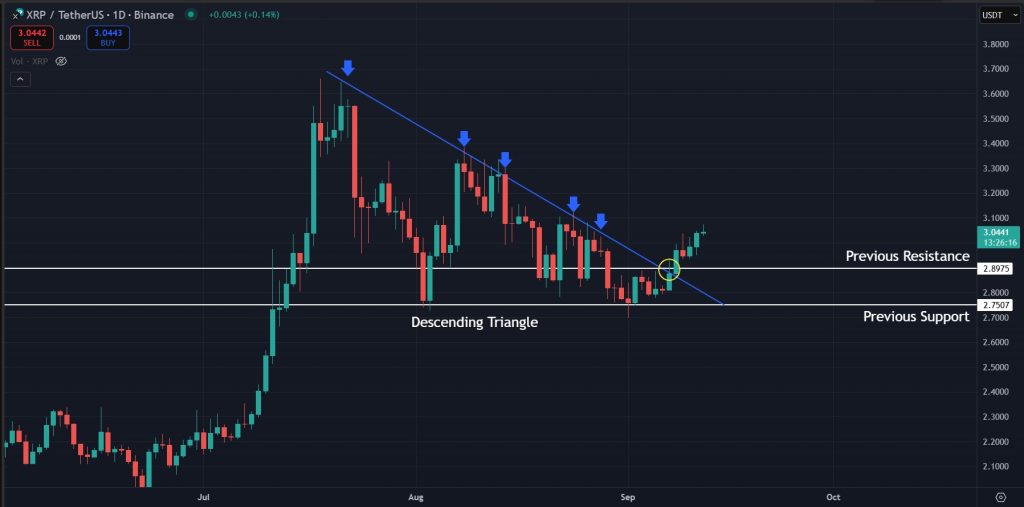
While the break of the $2.90 mark is significant, the main highlight on the 1-day timeframe is the break of the trendline resistance XRP has been facing for the past couple of months. We can see that the price has clearly broken above this slant resistance and is now gaining further momentum. This trendline was also forming a descending triangle pattern, which is statistically a bearish pattern. However, with the price breaking above the resistance, the pattern has been invalidated, and we will be looking for higher targets for XRP in the short term.
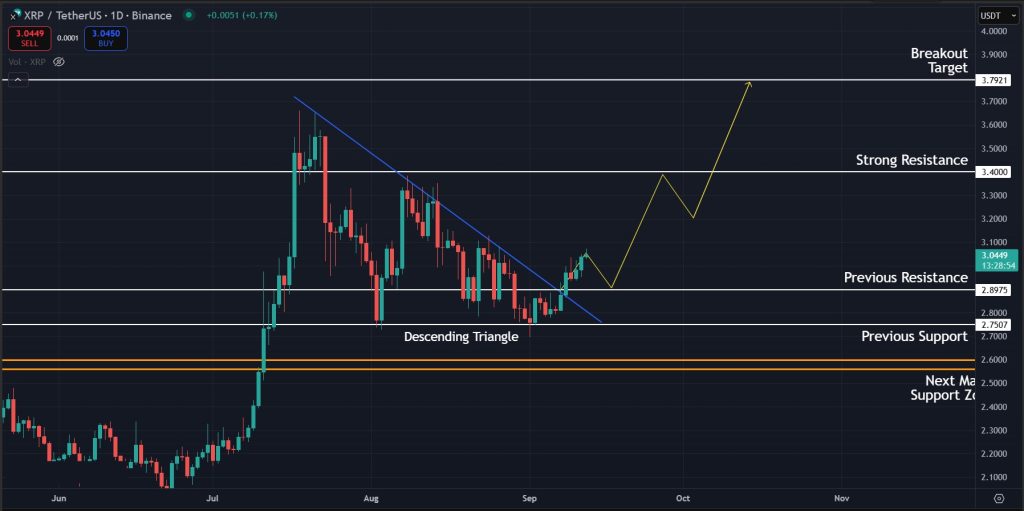
If the price were to continue gaining momentum here and the descending triangle were to play out as bullish, we can expect higher targets for XRP in the coming weeks. While our first target will be around the resistance at $3.40, our main breakout target will be just below the $3.80 mark, which is sitting above the previous all-time high.
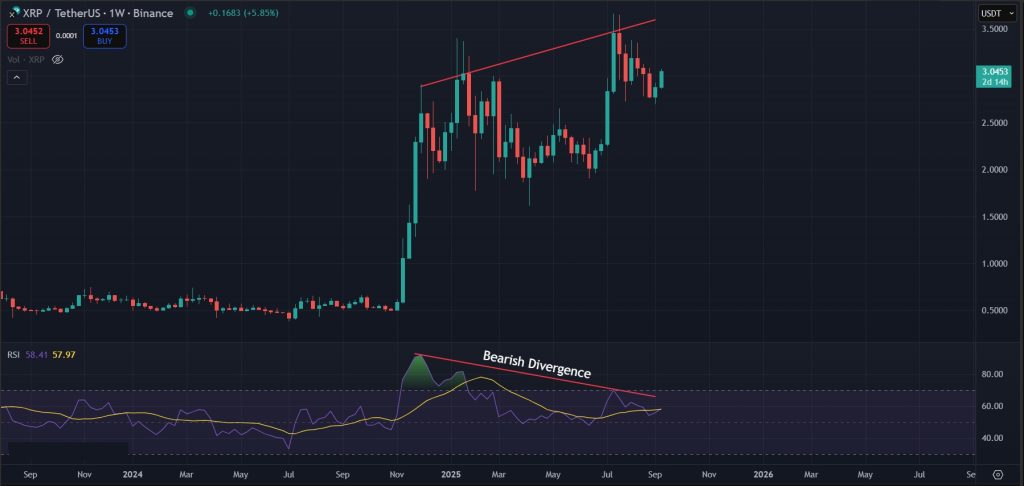
Lastly, zooming out to the 1-week timeframe, we also have a bearish divergence for XRP that still has not been invalidated. A bearish divergence indicates that the price is in the overbought category, and the price must invalidate this divergence with a clear move if the trend is to remain bullish in the coming days.
Final Takeaway: What is Next for XRP?
XRP is currently looking bullish on the lower timeframes, showing signs of strength by invalidating the descending triangle pattern. Right now, things are looking positive for the price action, and our XRP price prediction is leaning bullish. However, despite the momentum, we still have a bearish divergence on the 1-week chart that has not been invalidated. We will be eyeing higher targets for XRP in the coming days but with caution, as that bearish divergence can still push the price toward a correction.
Join WEEX and unlock 40 USDT back with your first deposit-and-trade step. Deposit 100 USDT and start trading.
Disclaimer: All content on The Moon Show is for informational and educational purposes only. The opinions expressed do not constitute financial advice or recommendations to buy, sell, or trade cryptocurrencies. Trading involves significant risk and may result in substantial losses. Always seek independent financial advice before making investment decisions. The Moon Show is not responsible for any financial losses or decisions made based on the information provided.
Please view the full disclaimer at: https://themoonshow.com/disclaimer

HYPE Drops Toward $60 As Chip Selloff Hits Crypto
HYPE dropped toward $60 on July 17 as a chip-led selloff pulled risk assets lower. The token fe...

ONDO Surges as DTCC Tokenized Stock Push Brings Wall Street Rails Onchain
ONDO became one of the market’s stronger movers after Ondo launched tokenized stock representat...

Chainlink Tests $8.40 As Mantle’s CCIP Move Puts LINK Back In Focus
Chainlink is getting fresh attention after Mantle moved its $2.5B+ Super Portal from LayerZero ...