 Price Analysis: Bullish Momentum Builds as Weekly Trend Strengthens")
Avalanche (AVAX) Price Analysis: Bullish Momentum Builds as Weekly Trend Strengthens
AVAX is currently hovering around the $34.5 mark and is still looking bullish in the short term. The price has been moving in a strong uptrend since the start of September, and even now, when the overall market is facing some selling pressure, AVAX seems to be holding strong. The crypto market experienced a sharp sell-off on Monday, and most cryptocurrencies, including Bitcoin and Ethereum, suffered. AVAX also dipped sharply toward the $29.5 mark but was able to recover and still managed to close with a green daily candle. Furthermore, Total Value Locked (TVL) is at its highest for AVAX since August 2022, which is another bullish sign for the altcoin. Let’s take a quick look at the latest AVAX charts to see where the price could be headed in the short term.
Our Avalanche (AVAX) Price Prediction Summary
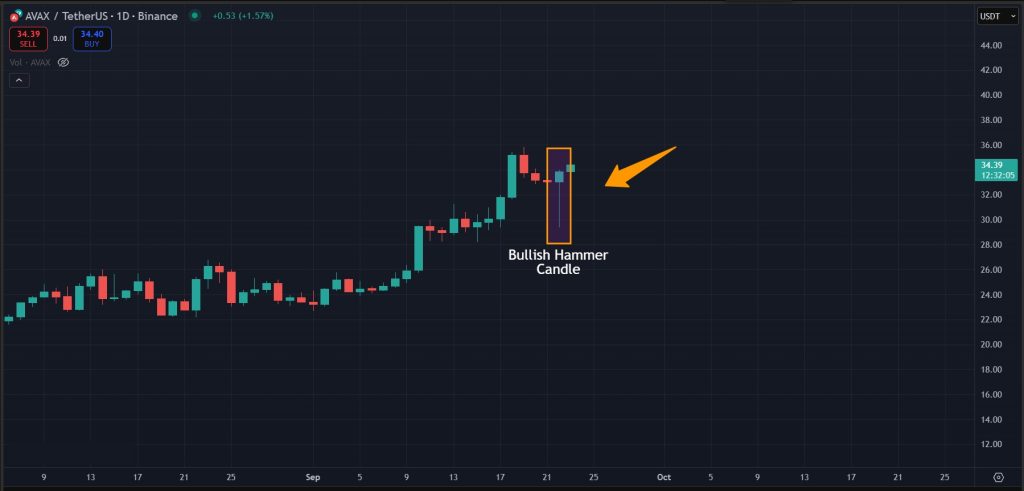
- AVAX shows short-term strength with a bullish hammer on the daily chart and $35 as the key resistance to break.
- $35 remains the key level to watch, with momentum pointing toward $40 if broken.
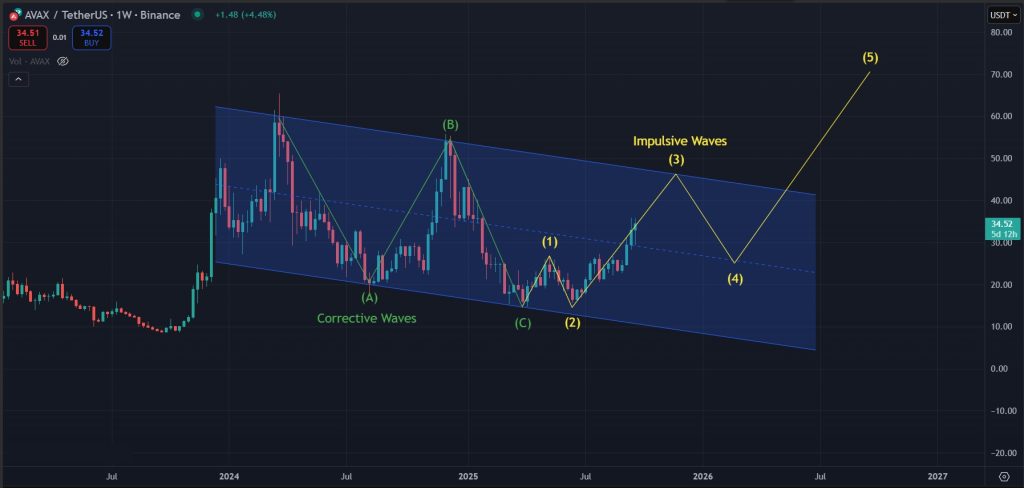
- Weekly charts suggest AVAX may have completed its ABC correction and is entering a new impulsive wave cycle.
Get started on WEEX with a simple 40 USDT reward. Deposit 100 USDT, make your trade, and claim the bonus.
Analyzing the Charts
Bullish Hammer on the Daily Timeframe
Looking at the latest 1-day charts for AVAX, the most notable detail is the Monday candle. The price dipped sharply but recovered, closing the day not only with a green candle but with a bullish hammer. A bullish hammer candle typically forms after a series of red candles and signals a potential reversal. This could suggest that the minor correction AVAX needed is already complete, setting the stage for another upward move.
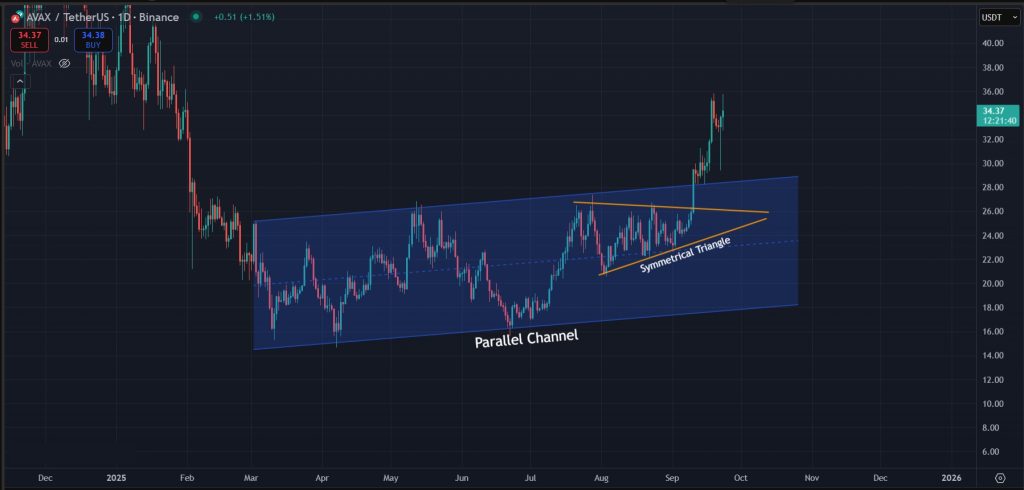
Breakout from the Parallel Channel and Symmetrical Triangle
Another key point is that the price has been gaining strength since breaking out of the parallel channel it had followed for months. Within this channel, a symmetrical triangle pattern had formed, and the breakout from that structure gave AVAX the momentum to set a new local high. With this strength still intact, AVAX is likely to continue its trend in the short term, which is why our latest AVAX price prediction leans bullish.
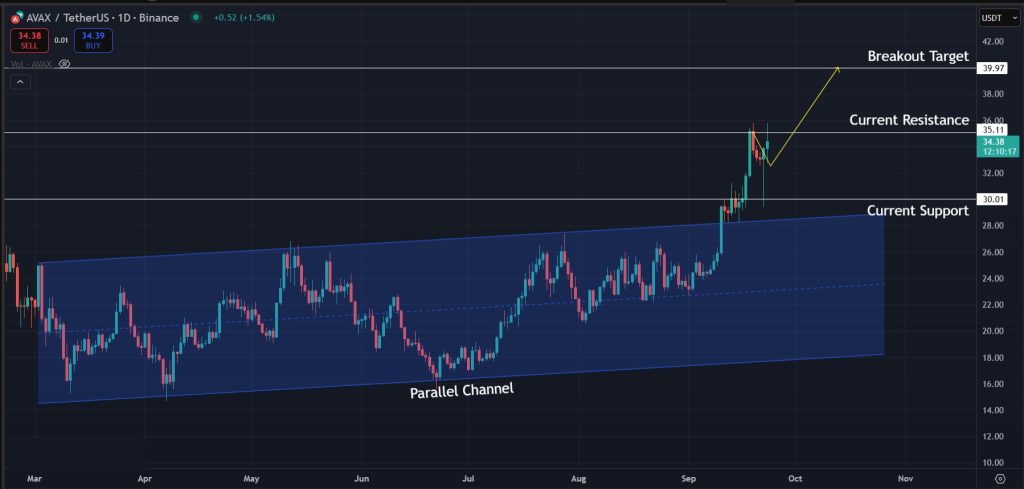
Resistance and Support Levels to Watch
The key resistance level to watch for AVAX is $35.0, which has capped the price throughout the past week. A breakout above this level could open the way toward $40.0, the measured breakout target from the parallel channel. On the downside, if momentum fades and the price fails to hold, the critical support to watch is $30.0, as losing this level would weaken the bullish structure.
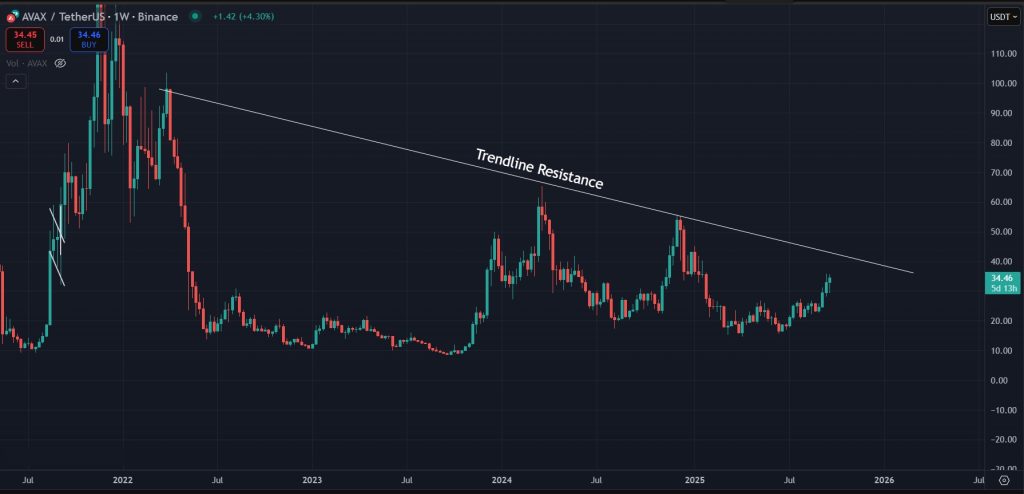
Weekly Trendline and Upside Potential
On the 1-week timeframe, the broader picture shows AVAX still trading below the long-term trendline resistance it has respected for years, while maintaining solid upside potential. The chart also indicates that AVAX could reach the $40 level, as this major resistance is not expected to come into play until then.
ABC Correction and Impulsive Waves Setup
Another bullish sign is that AVAX seems to have completed an ABC correction within its long-term weekly channel. In Elliott Wave Theory, the ABC pattern usually marks the end of a corrective phase that follows a 1–5 impulsive move. Once this correction is done, the next cycle often begins with a fresh 1–5 impulsive wave structure. AVAX now appears to be entering the third impulsive wave of this sequence, which is typically the strongest and most extended. A breakout above the channel would confirm that the macro correction is over and set the stage for AVAX to target new highs.
Final Takeaway: What is Next for Avalanche (AVAX)?
In conclusion, AVAX is showing resilience despite broader market pressure and continues to hold its bullish structure. On the 1-day timeframe, the bullish hammer and breakout momentum point toward further upside, with $35 as the key resistance and $40 as the next target if broken. On the weekly chart, the long-term trendline remains the major hurdle, but the completion of an ABC correction and the start of a new impulsive wave signal renewed strength. As long as $30 holds as support, the indicators suggest AVAX is positioned for further gains in the short term, with the potential for higher moves once the larger channel resistance is cleared.
Start trading on WEEX with a 100 USDT deposit and unlock 40 USDT back after completing your first trading step.
Disclaimer: All content on The Moon Show is for informational and educational purposes only. The opinions expressed do not constitute financial advice or recommendations to buy, sell, or trade cryptocurrencies. Trading involves significant risk and may result in substantial losses. Always seek independent financial advice before making investment decisions. The Moon Show is not responsible for any financial losses or decisions made based on the information provided.
Please view the full disclaimer at: https://themoonshow.com/disclaimer

HYPE Drops Toward $60 As Chip Selloff Hits Crypto
HYPE dropped toward $60 on July 17 as a chip-led selloff pulled risk assets lower. The token fe...

ONDO Surges as DTCC Tokenized Stock Push Brings Wall Street Rails Onchain
ONDO became one of the market’s stronger movers after Ondo launched tokenized stock representat...

Chainlink Tests $8.40 As Mantle’s CCIP Move Puts LINK Back In Focus
Chainlink is getting fresh attention after Mantle moved its $2.5B+ Super Portal from LayerZero ...