
Ethereum ETFs Pull In $697M as ETH Tries to Hold Its August Breakout
Ethereum is trading near $2,469 after one of its strongest weeks of 2026, while U.S. spot Ether ETFs recorded a sharp return of institutional demand. The funds attracted $697.2 million in net inflows during the week ending August 21, their best result since October 2025. ETH rallied from below $2,000 to a high near $2,545 during the same period. Price has since cooled without giving back the bulk of that move, leaving buyers with a different challenge. Instead of breaking out, they now need to prove that the new structure can hold.
Key Takeaways
- U.S. spot Ether ETFs attracted $697.2 million last week, their strongest weekly inflow since October 2025.
- ETF trading volume jumped from $1.9 billion to $6.9 billion as activity accelerated alongside the rally.
- ETH surged from below $2,000 to roughly $2,545 before consolidating near $2,469.
- $2,545 remains the breakout trigger, while $2,325 is the key support separating a healthy pullback from a deeper reversal.
Ether ETFs Record Their Strongest Week of 2026
Institutional demand returned to Ethereum at a much larger scale last week.
U.S. spot Ether ETFs recorded $697.2 million in net inflows during the five sessions through August 21, according to SoSoValue data analyzed by The Block. That was their strongest result since the week ending October 3, 2025, when inflows approached $1.3 billion.
The turnaround was particularly sharp because Ether ETFs had recorded a small $2.3 million net outflow the previous week.
Trading activity accelerated at the same time. Weekly volume climbed from $1.9 billion to $6.9 billion, an increase of roughly 259%, while net assets rose from $10.5 billion to $14.3 billion.
The asset increase should not be confused with fresh investment. Only $697.2 million represents net new inflows. Much of the remaining increase came from ETH's own price appreciation, which raised the value of assets the funds already held.
ETF Demand Looks Very Different From July
The latest numbers also show how much Ethereum's position has changed in a relatively short period.
When we last covered Ethereum's ETF recovery in July, ETH was trading near $1,740 while the funds had recorded $70.5 million in daily inflows. Price was still trying to hold $1,700 and build a recovery above $1,750.
Ethereum spent much of early August below $2,000 before that structure changed rapidly last week.
ETH closed around $2,253 on August 19 after gaining more than 17% in one session. It pushed through $2,300 the following day and reached approximately $2,545 on August 21 before the rally finally slowed.
The ETF numbers do not prove that institutional buying caused the entire move. Bitcoin and the wider crypto market were rallying at the same time, while short covering also contributed to the acceleration.
What the flows do show is that Ethereum's breakout happened alongside a meaningful increase in capital entering regulated Ether products. That gives the move stronger backing than price momentum alone.
The next test is whether ETH can keep enough of that breakout intact once the initial surge fades.
Ethereum Technical Analysis on the 4-Hour Chart
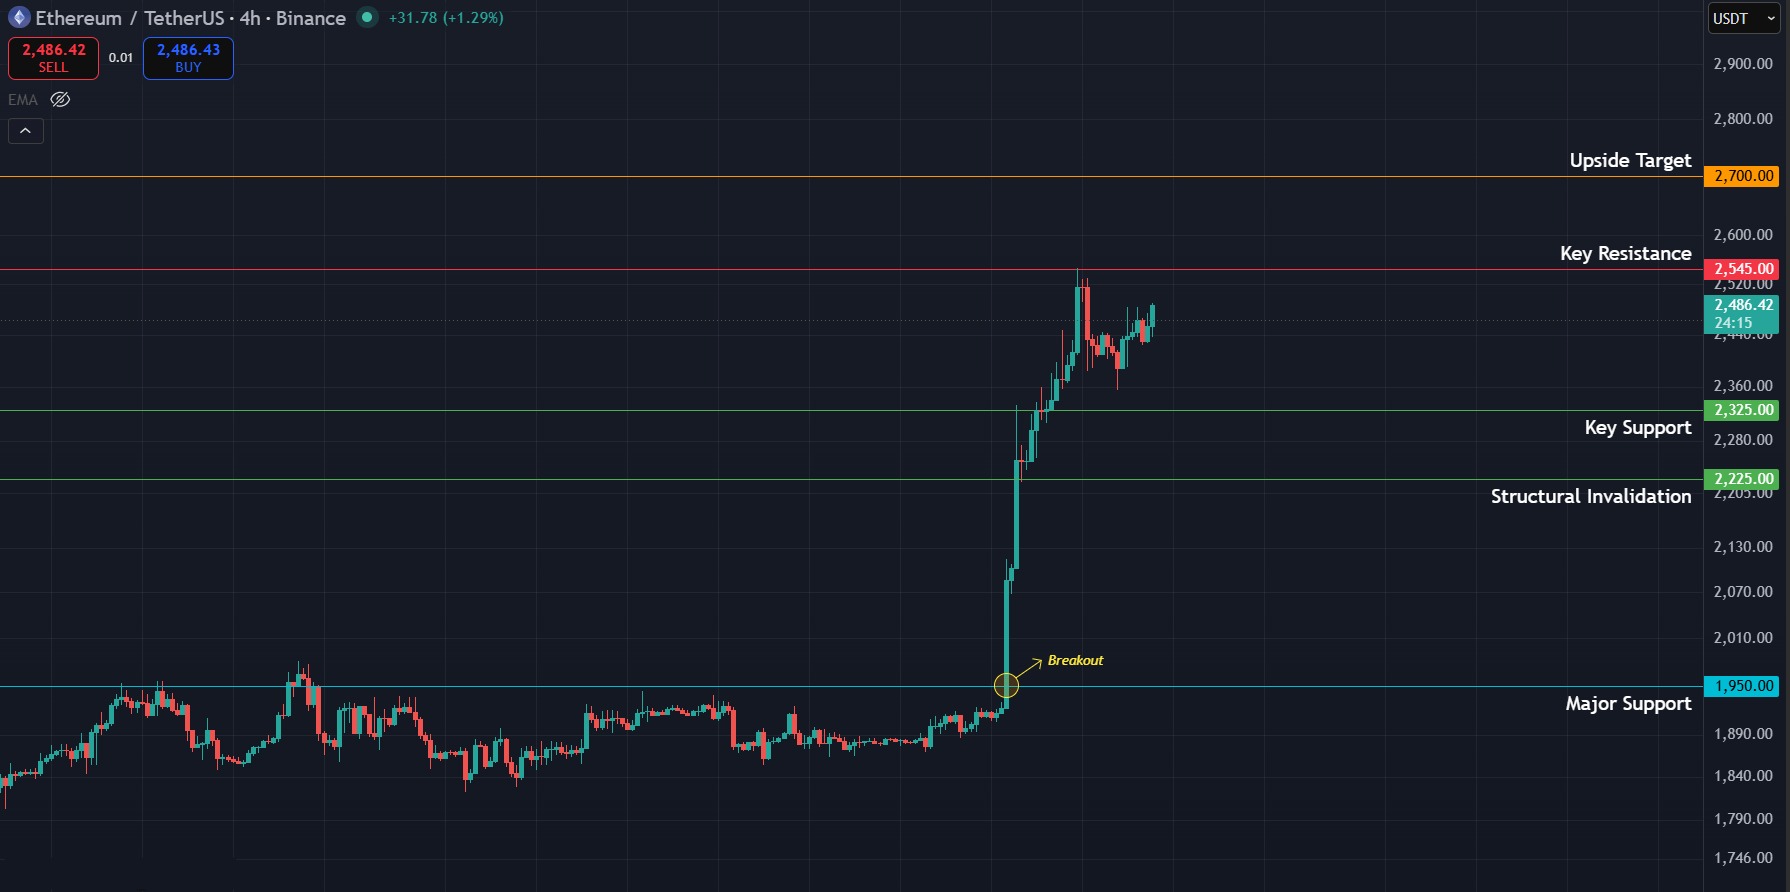
The 4-hour chart gives a cleaner view of Ethereum's current setup than the daily chart because ETH is now consolidating after an unusually fast multi-session rally.
Price is trading near $2,469, below the August 21 high around $2,545 but still well above the base of the breakout.
$2,545 is the key resistance. It marks the high where the latest advance stalled. A completed 4-hour close above it would confirm that buyers have absorbed the post-rally selling and are ready to extend the move.
If that happens, $2,700 becomes the next larger upside target. This area mattered during Ethereum's late-January breakdown, when price traded around $2,700 before the selloff accelerated toward the low-$2,000s. It therefore represents a more meaningful higher resistance than simply adding another nearby round number such as $2,600.
The downside structure is wider. $2,325 is the key support. ETH first reached this area during the August 19 breakout and then returned almost exactly to it during the August 21 session before rallying toward $2,545. That resistance-to-support reaction makes $2,325 the level that now defines whether the breakout itself remains healthy.
A completed 4-hour close below $2,325 would signal that ETH is giving back more than a normal consolidation. It would also expose $2,225, close to the August 20 reaction low around $2,224.
That makes $2,225 the wider structural invalidation. Losing it would put ETH back beneath the base that supported the final leg of last week's rally and materially weaken the bullish structure.
For now, buyers still have control while ETH remains above $2,325. A close above $2,545 would confirm continuation, while a break below $2,325 would shift attention from consolidation to a deeper retracement.
What to Expect Next
- Bullish case: ETH holds $2,325 and closes above $2,545, opening a move toward $2,700.
- Bearish case: A completed 4-hour close below $2,325 exposes $2,225.
- Key catalyst: Continued spot ETF inflows would strengthen the evidence that institutional demand remains behind Ethereum's recovery.
- Invalidation: A completed 4-hour close below $2,225 would invalidate the immediate breakout structure.
FAQs
Why are Ethereum ETF inflows important?
Spot ETF inflows show how much new capital is entering regulated ETH products. Last week's $697.2 million total was the strongest weekly result since October 2025.
What level does ETH need to hold?
$2,325 is the key support for the current breakout. A 4-hour close below it would weaken the structure and put $2,225 back in focus.
Get started on WEEX with a simple 40 USDT reward. Deposit 100 USDT, make your trade, and claim the bonus
Disclaimer: All content on The Moon Show is for informational and educational purposes only. The opinions expressed do not constitute financial advice or recommendations to buy, sell, or trade cryptocurrencies. Trading involves significant risk and may result in substantial losses. Always seek independent financial advice before making investment decisions. The Moon Show is not responsible for any financial losses or decisions made based on the information provided.
Please view the full disclaimer at: https://themoonshow.com/disclaimer

Bitcoin and Ethereum Quarterly Returns 2026: Q1-Q3 Trends and Q4 Outlook
Quarterly returns for Bitcoin (BTC) and Ethereum (ETH) offer a simple way to measure how the tw...

LINK Breaks August High as Chainlink Expands Into Global Payments
LINK is holding above $13 on September 7 after gaining 9.9% in the previous session. The move c...

XRP ETF Inflow Streak Ends After $170M Run. Can Price Hold $1.31?
XRP is trading near $1.36 on September 3 after U.S. spot XRP ETFs recorded their first net outf...