
Bitcoin Breakout Gains Support From $517M ETF Inflows After Treasury Shift
Bitcoin has surged from the mid-$60,000s to around $77,750 in a matter of days after an unexpected shift in U.S. Treasury bond-buyback policy weakened the dollar and briefly pulled long-term yields lower. The first leg of the rally was amplified by short covering, but fresh ETF data adds another layer to the move. U.S. spot Bitcoin funds attracted more than $517 million in a single session as BTC pushed through levels that had capped price since early summer. The question now is whether that demand can help Bitcoin turn a sharp squeeze into a sustained breakout.
Key Takeaways
- The U.S. Treasury doubled the size of planned buybacks for 10- to 30-year debt to at least $4 billion per operation.
- Bitcoin has gained close to 20% this week and reached its highest level in more than two months.
- U.S. spot Bitcoin ETFs recorded $517.19 million in net inflows on August 19, their strongest day since May 4.
- BTC is now challenging the same broader price region that capped the market during May, making daily closes increasingly important.
Treasury Buyback Shift Sends Bitcoin Through $70K
Bitcoin's breakout began after the Treasury unexpectedly expanded its support for the long end of the U.S. bond market.
The Treasury doubled planned buybacks of 10- to 30-year debt to at least $4 billion per operation after a selloff pushed long-term yields sharply higher. The announcement initially pulled yields lower and pressured the dollar, helping assets such as Bitcoin and gold.
Bitcoin responded by clearing $70,000 for the first time since June. Reuters also noted that short covering helped accelerate the rally after weeks of relatively narrow trading.
The bond-market relief has not been completely sustained. Long-term yields have since climbed again, which makes the strength in Bitcoin more interesting. BTC continued higher on August 21 even as global stocks remained under pressure and the 10-year Treasury yield returned to around 4.7%.
That suggests the rally is no longer relying on the initial Treasury reaction alone.
$517M ETF Inflow Adds Spot Demand Behind the Rally
The next piece came from U.S. spot Bitcoin ETFs.
The funds recorded $517.19 million in net inflows on August 19, their largest daily intake since May 4. Eight of the 12 funds finished the session with inflows, led by roughly $284.7 million into BlackRock's IBIT.
The timing is important because the Treasury announcement and short covering helped start the move, while the ETF inflows arrived as Bitcoin was already breaking higher. That does not prove ETFs will keep the rally going, but it provides evidence that the move was accompanied by fresh spot investment rather than leverage alone.
Bitcoin has since extended the advance. Reuters had BTC around $76,446 earlier on August 21, up almost 6% on the day and close to 20% for the week. Price has subsequently moved into the upper-$77,000s.
The stronger dollar-debasement narrative has also helped. The dollar is down roughly 1% this week as concerns around U.S. debt and fiscal policy have encouraged renewed interest in scarce assets including Bitcoin and gold.
Bitcoin Has Finally Left the July Range Behind
The latest move changes the structure we were watching earlier this month.
In our August 10 Bitcoin analysis, BTC was still near $65,000 and needed to clear $66,000 before challenging the July swing high around $66,900.
Both levels are now well below price.
Bitcoin broke through $70,000 on August 19 and continued higher through the low-$70,000s on August 20. The advance has now carried BTC back into price territory last seen in May.
That requires a wider timeframe. The immediate question is no longer whether Bitcoin can escape the July range. It is whether the breakout can survive its first encounter with the larger May structure.
Bitcoin Technical Analysis on the Daily Chart
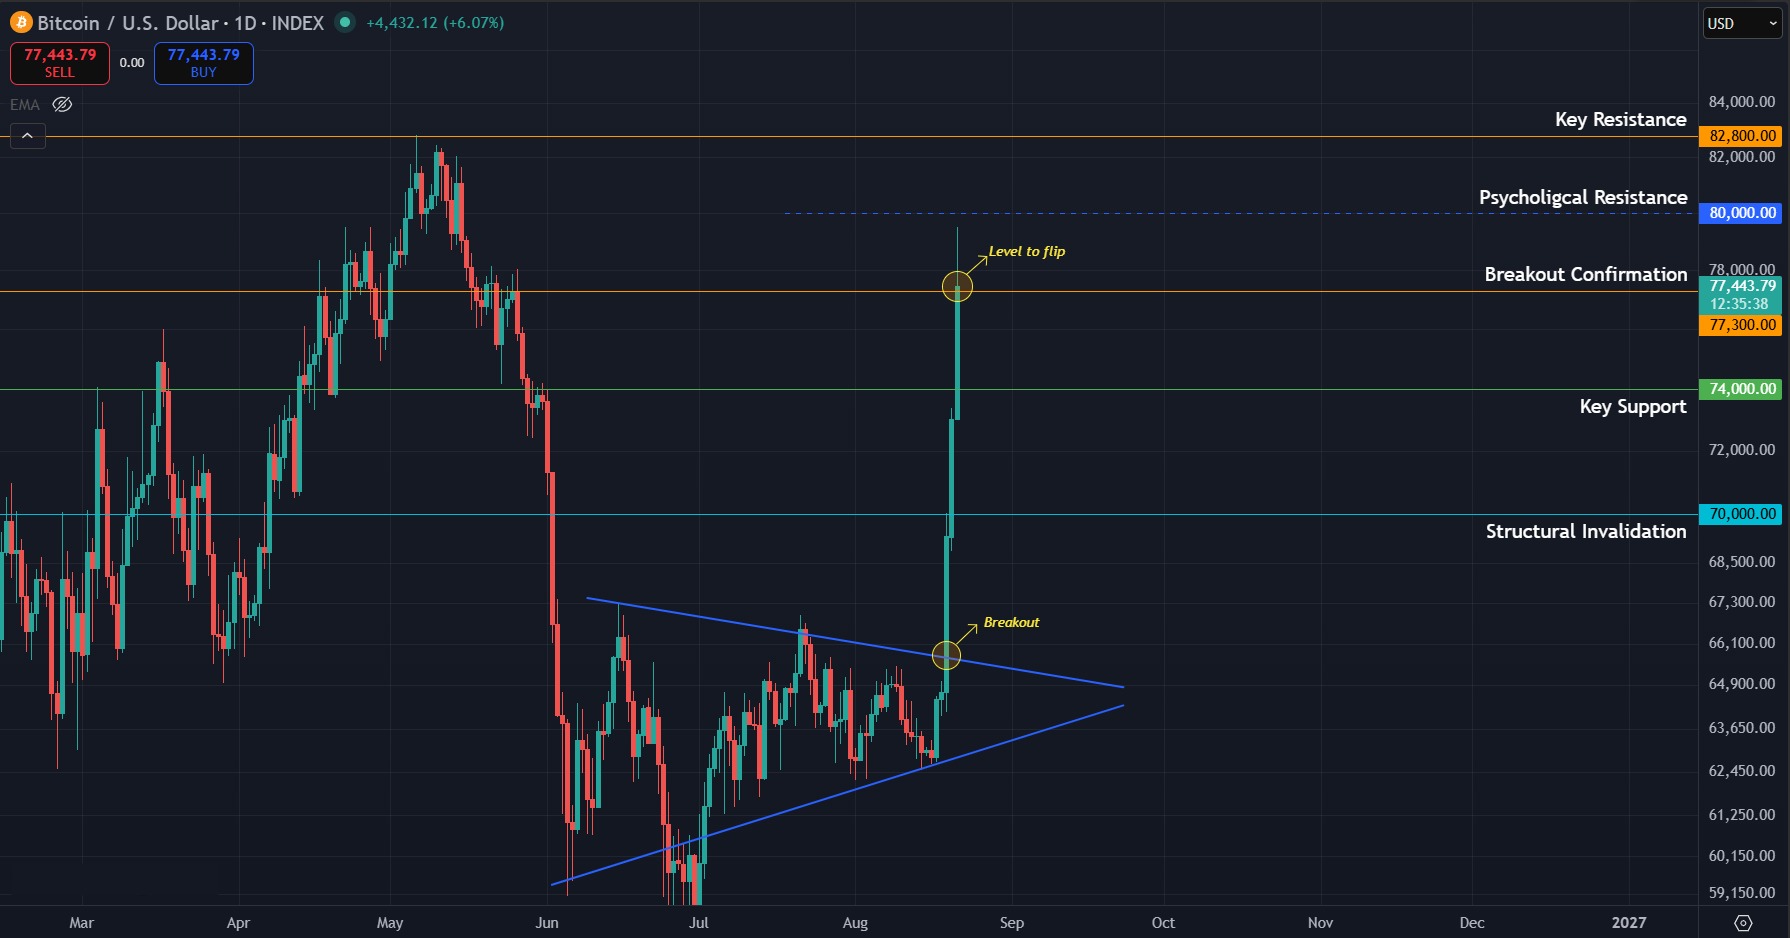
BTC/USDT 1-day chart. Chart via TradingView.
Bitcoin is trading near $77,750 on the daily chart after briefly reaching roughly $79,200 during the latest advance.
The first important level is $77,300. Bitcoin repeatedly traded around this area during the second half of May, including several highs and closes between roughly $77,000 and $78,000. Price is currently above it intraday, but today's daily candle has not closed yet.
A completed daily close above $77,300 would therefore confirm that Bitcoin has moved beyond another layer of the May structure rather than simply wicking through it.
Above that, the larger target sits around $82,800. Bitcoin reached approximately $82,833 on May 6 before the broader May decline developed. That makes it the next major structural resistance if the current breakout survives.
The downside is now much further away than it was in our previous article.
$74,000 is the first important support. BTC traded repeatedly around this area during late May and early June before the market eventually broke lower. A pullback that holds $74,000 would therefore leave the new daily breakout intact.
The more important failure level is $70,000. Bitcoin only reclaimed this threshold during the latest surge after spending more than two months below it. A completed daily close back under $70,000 would signal that the breakout has lost much of its structure rather than simply undergoing a normal pullback.
The daily chart therefore remains bullish while BTC holds above the old breakout area. Buyers still need a confirmed close above $77,300 before the route toward $82,800 becomes cleaner.
What to Expect Next
- Bullish case: Bitcoin closes above $77,300 and extends the breakout toward $82,800.
- Bearish case: BTC falls back below $74,000, opening a deeper retest of $70,000.
- Key catalyst: Continued ETF demand would strengthen the argument that spot buying is supporting the rally after the initial short squeeze.
- Invalidation: A completed daily close below $70,000 would invalidate the current breakout structure.
FAQs
Are ETF inflows driving the Bitcoin rally?
ETF inflows are supporting the move, but they were not the only catalyst. The rally began around the Treasury bond-buyback announcement and was amplified by short covering before the $517 million ETF inflow was reported.
What is the next major Bitcoin resistance?
Bitcoin first needs to confirm the move above $77,300 on the daily chart. The next larger structural resistance sits around $82,800, near Bitcoin's May high.
Get started on WEEX with a simple 40 USDT reward. Deposit 100 USDT, make your trade, and claim the bonus
Disclaimer: All content on The Moon Show is for informational and educational purposes only. The opinions expressed do not constitute financial advice or recommendations to buy, sell, or trade cryptocurrencies. Trading involves significant risk and may result in substantial losses. Always seek independent financial advice before making investment decisions. The Moon Show is not responsible for any financial losses or decisions made based on the information provided.
Please view the full disclaimer at: https://themoonshow.com/disclaimer

Bitcoin and Ethereum Quarterly Returns 2026: Q1-Q3 Trends and Q4 Outlook
Quarterly returns for Bitcoin (BTC) and Ethereum (ETH) offer a simple way to measure how the tw...

LINK Breaks August High as Chainlink Expands Into Global Payments
LINK is holding above $13 on September 7 after gaining 9.9% in the previous session. The move c...

XRP ETF Inflow Streak Ends After $170M Run. Can Price Hold $1.31?
XRP is trading near $1.36 on September 3 after U.S. spot XRP ETFs recorded their first net outf...