 Price Analysis (Jul 25, 2025): Daily Structure Intact Despite Breakdown on Lower Timeframes")
Bitcoin (BTC) Price Analysis (Jul 25, 2025): Daily Structure Intact Despite Breakdown on Lower Timeframes
Bitcoin is currently trading around $116,500 and showing signs of weakness on the lower timeframes. As highlighted in the previous analysis, the price has remained in a consolidation phase for the past couple of weeks. Buyers have struggled to break through the $120,000 resistance, which continues to cap any meaningful upside. While the broader structure still holds, the market hasn't shown enough strength to confirm a breakout toward the $130,000 target. At this stage, both a continuation higher and a short-term pullback remain possible. To get a clearer view, let’s take a closer look at the current price action.
Get started on WEEX with a simple 40 USDT reward. Deposit 100 USDT, make your trade, and claim the bonus.
Analyzing the Charts
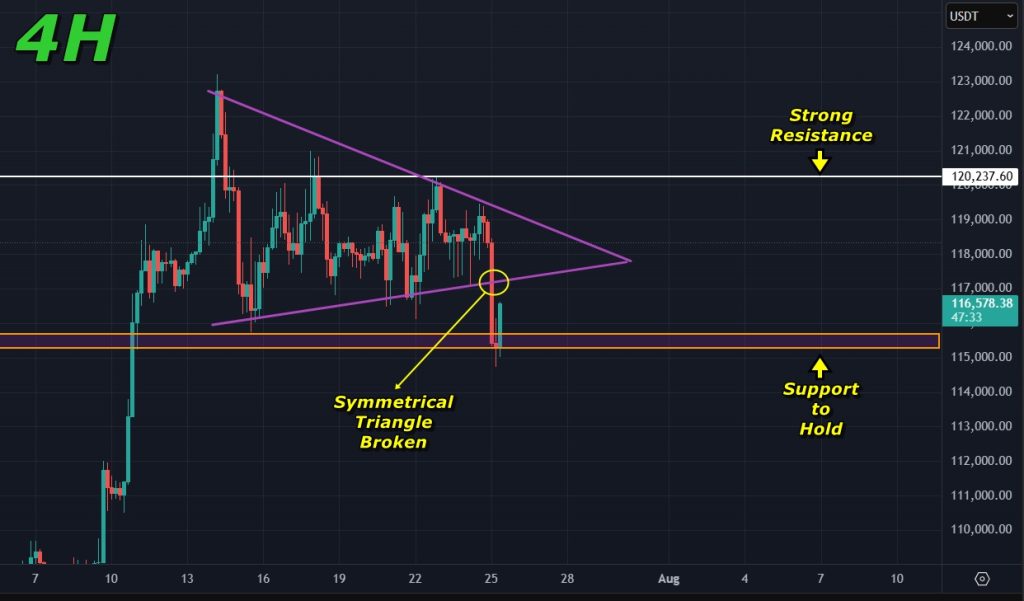
The 4-hour chart shows that Bitcoin recently broke below a symmetrical triangle pattern that had been forming over the past few sessions. This breakdown signals weakness in the short term and puts pressure on immediate support levels. Price is now retesting a key zone just below $116,000, which has acted as strong support in the past few weeks. Holding this level is crucial to keep the broader bullish structure intact. A clean bounce from here could reopen the path toward higher targets, while a breakdown may expose the price to lower levels in the short term. For now, the short-term Bitcoin price prediction hinges on whether this support holds or gives way.
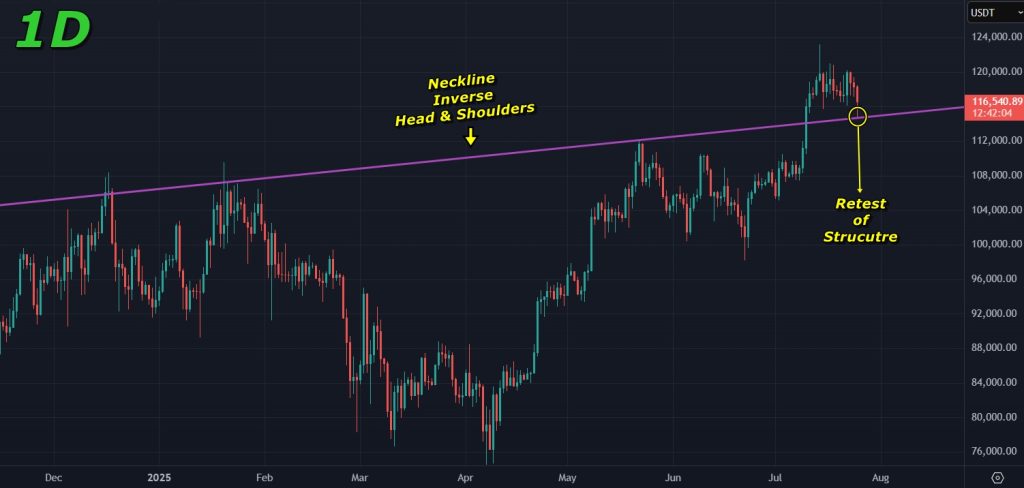
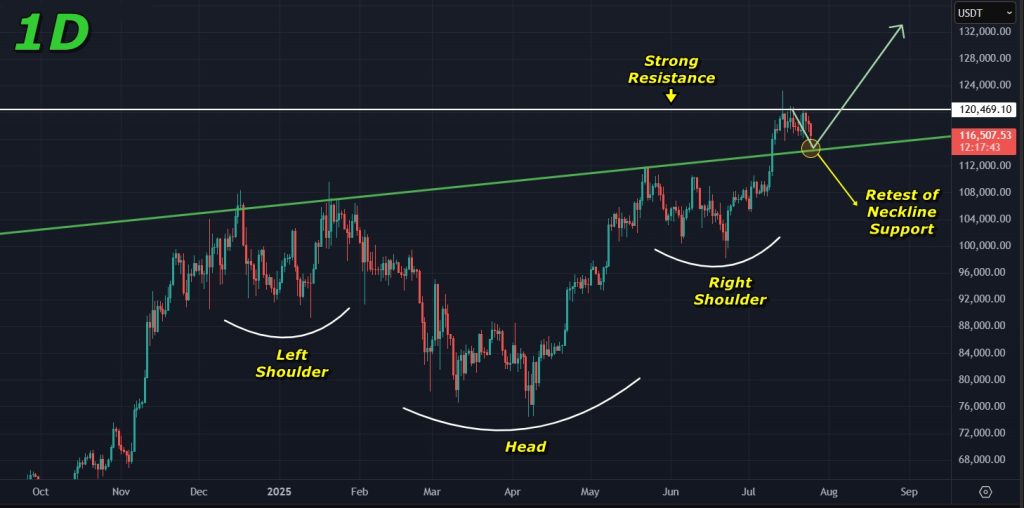
Shifting to the daily timeframe, the recent pullback looks far less concerning. In fact, the move appears to be a potential retest of the neckline from the inverse head and shoulders pattern that Bitcoin broke out of earlier. This kind of retest is common in technical setups and often serves to confirm the breakout. If this zone holds, it could simply be a bear trap before the next leg higher. A successful bounce here would keep the possibility of a third impulsive wave toward the upside firmly on the table.
If the price manages to bounce from this zone, a move back toward the $120,000 resistance looks likely. This would mark yet another test of that key level, and given the current structure, there’s a stronger chance it breaks this time. A clean breakout above $120,000 would open the door toward the next major target around $130,000 and possibly higher. There’s also a slight uptick in volume on the 4-hour chart, which supports the case for a bullish continuation if momentum picks up.
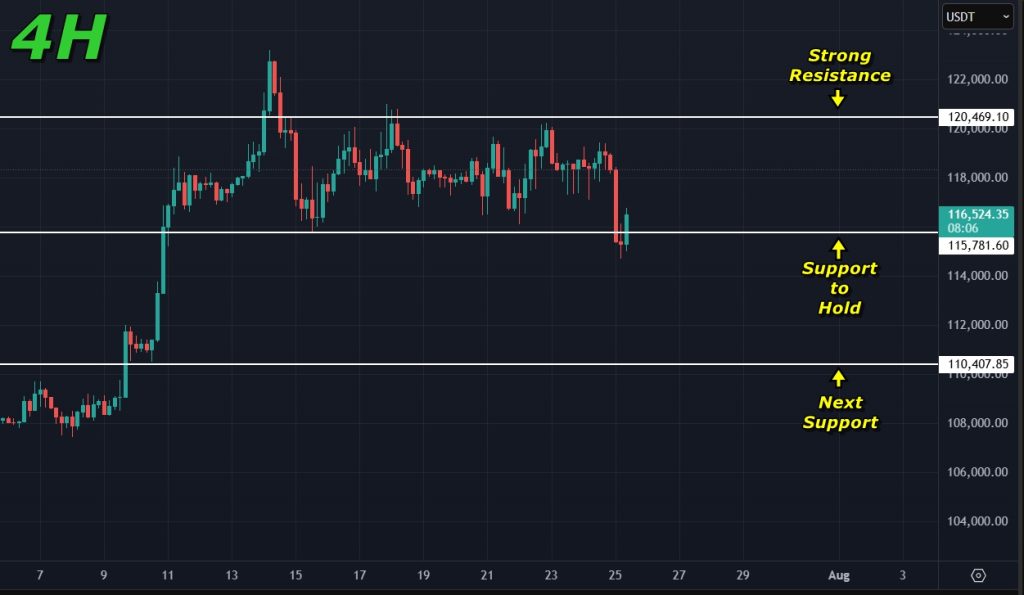
On the flip side, if Bitcoin fails to hold the support just below $116,000, a deeper correction could follow. In that case, the next key level to watch sits around $110,500, which has previously acted as a strong support zone. A drop to this region would weaken the short-term bullish structure and could delay any upward continuation.
Final Takeaway: What is Next for Bitcoin (BTC)?
Bitcoin is trading around $116,500 and showing mixed signals across different timeframes. On the lower charts, price action looks weak, but the daily structure still leans bullish. For now, $116,000 remains a key support to hold. If it does, a move back to $120,000 and possibly $130,000 could follow. But if the support breaks, Bitcoin may head toward $110,500 before finding its footing again.
Start trading on WEEX with a 100 USDT deposit and unlock 40 USDT back after completing your first trading step.
Disclaimer: All content on The Moon Show is for informational and educational purposes only. The opinions expressed do not constitute financial advice or recommendations to buy, sell, or trade cryptocurrencies. Trading involves significant risk and may result in substantial losses. Always seek independent financial advice before making investment decisions. The Moon Show is not responsible for any financial losses or decisions made based on the information provided.
Please view the full disclaimer at: https://themoonshow.com/disclaimer

HYPE Drops Toward $60 As Chip Selloff Hits Crypto
HYPE dropped toward $60 on July 17 as a chip-led selloff pulled risk assets lower. The token fe...

ONDO Surges as DTCC Tokenized Stock Push Brings Wall Street Rails Onchain
ONDO became one of the market’s stronger movers after Ondo launched tokenized stock representat...

Chainlink Tests $8.40 As Mantle’s CCIP Move Puts LINK Back In Focus
Chainlink is getting fresh attention after Mantle moved its $2.5B+ Super Portal from LayerZero ...