 Price Analysis: Double-Bottom Setup or Deeper Correction Ahead?")
Bitcoin (BTC) Price Analysis: Double-Bottom Setup or Deeper Correction Ahead?
Bitcoin is currently trading around $112,500 and is attempting to regain momentum on the lower timeframes. As noted in our previous analysis, BTC has been losing strength after setting a new all-time high just a few days ago and has since slipped into a downtrend. For now, the support zone to watch remains near the $120,000 area, which continues to hold well on shorter timeframes. With that in mind, let’s take a closer look at the latest Bitcoin charts to assess where the price may be headed in the coming days.
Key Takeaways
- Bitcoin is holding the $112,000 support, a crucial level for the next move.
- A bounce here could trigger a bullish double-bottom pattern and potentially retest the all-time high.
- Failure to hold support may lead to a deeper correction below $110,000 as the rising wedge on the weekly timeframe plays out.
Analyzing the Charts
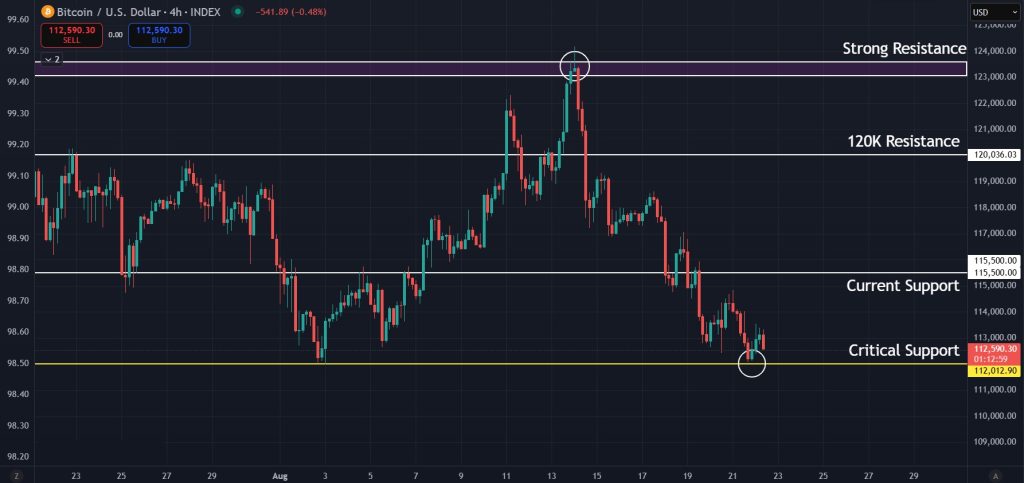
Looking at the latest 4-hour chart, Bitcoin has been under consistent selling pressure since it reached its recent all-time high. The price was rejected around the $124,000 level and has since struggled to establish the $120,000 region as support. It also failed to hold the immediate support at $115,500, a level that had provided several strong bounces in recent sessions.
Potential Double-Bottom on the 1D Timeframe
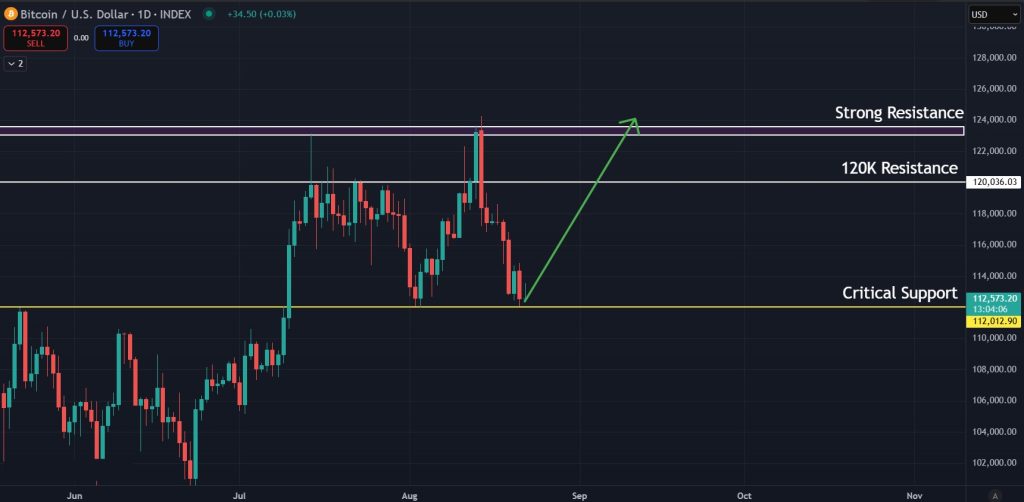
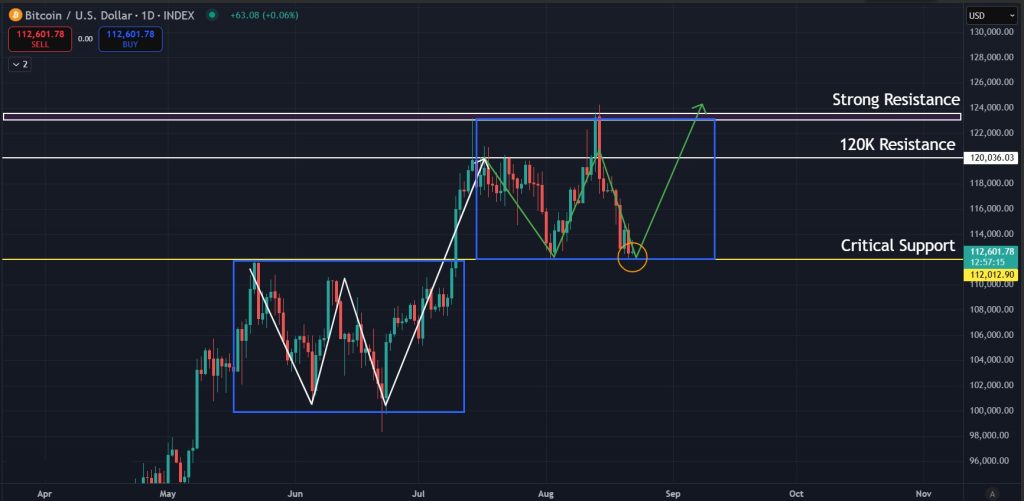
Now shifting to the daily timeframe, we can see that Bitcoin is testing the key support at $112,000. The price recently bounced from this level with strong momentum, showing how important it is for the market. If Bitcoin manages to hold here and pick up liquidity, we could see another rally take shape. A bounce from this point would also create a double-bottom pattern, which is a bullish signal. If confirmed, it could give Bitcoin the push to form another wave up and challenge the resistance near its all-time high once again, shaping a short-term Bitcoin price prediction that leans bullish.
This price action also looks similar to what we saw during June and July. Back then, Bitcoin formed a clear double-bottom pattern which eventually led to a strong breakout and pushed the price to new all-time highs. If the current structure follows the same path, a similar move could take shape in the days ahead.
Lagging Behind the Global M2 Money Supply
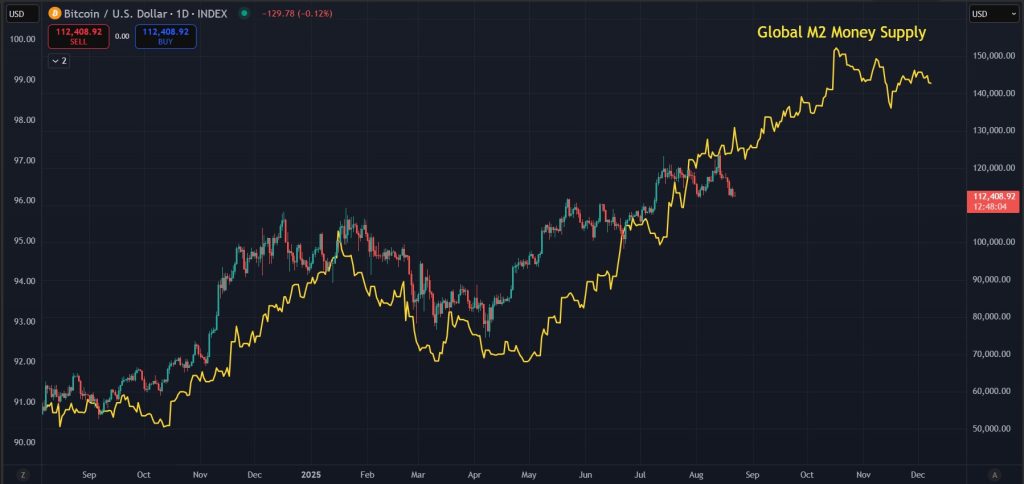
On the other hand, the price action still lags behind the Global M2 money supply. Historically, Bitcoin has a tendency to catch up with this trend, which slightly increases the chances of another leg higher. This factor adds more weight to the bullish scenario we are watching.
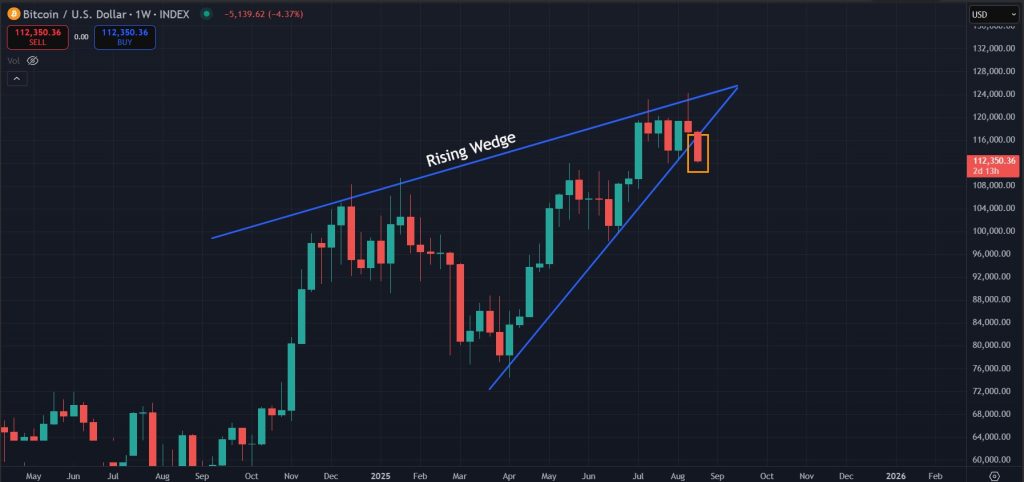
Rising Wedge on the 1W Timeframe
However, as mentioned in our previous analysis, Bitcoin has broken below the rising wedge it was forming on the weekly timeframe which is a bearish sign. It is also still looking likely that Bitcoin will correct further and might go even below $110,000 in the coming weeks. Whether we go down further or not will depend on how the price reacts to the $112,000 mark in the coming days.
Final Takeaway: What is Next for Bitcoin (BTC)?
Bitcoin is trading near $112,500 with the $112,000 level acting as the key support to watch. A bounce here could trigger a bullish setup, with the potential for a double-bottom pattern similar to the structure we saw in June and July that eventually led to new highs. The fact that Bitcoin is still lagging behind the Global M2 money supply also adds weight to the possibility of another leg higher. At the same time, the weekly chart has broken down from a rising wedge, which is a bearish signal and leaves room for further downside. If $112,000 fails to hold, the price could slip below $110,000 in the weeks ahead. How Bitcoin reacts around this support zone will decide whether we see another wave up or a deeper correction before momentum returns.
Get started on WEEX with a simple 40 USDT reward. Deposit 100 USDT, make your trade, and claim the bonus.
Disclaimer: All content on The Moon Show is for informational and educational purposes only. The opinions expressed do not constitute financial advice or recommendations to buy, sell, or trade cryptocurrencies. Trading involves significant risk and may result in substantial losses. Always seek independent financial advice before making investment decisions. The Moon Show is not responsible for any financial losses or decisions made based on the information provided.
Please view the full disclaimer at: https://themoonshow.com/disclaimer

HYPE Drops Toward $60 As Chip Selloff Hits Crypto
HYPE dropped toward $60 on July 17 as a chip-led selloff pulled risk assets lower. The token fe...

ONDO Surges as DTCC Tokenized Stock Push Brings Wall Street Rails Onchain
ONDO became one of the market’s stronger movers after Ondo launched tokenized stock representat...

Chainlink Tests $8.40 As Mantle’s CCIP Move Puts LINK Back In Focus
Chainlink is getting fresh attention after Mantle moved its $2.5B+ Super Portal from LayerZero ...