 Price Analysis (Aug 20, 2025): Double-Bottom Setup or Deeper Correction Toward $100K?")
Bitcoin (BTC) Price Analysis (Aug 20, 2025): Double-Bottom Setup or Deeper Correction Toward $100K?
Bitcoin is currently trading around $113,500 and remains bearish in the short term. The price is struggling to build momentum after losing the $115,500 support and is now moving toward lower levels. For the past couple of months, Bitcoin has been consolidating below $120,000, and with repeated failures to break higher, the outlook points to further downside. This makes a short-term correction more likely. Let’s look at the latest BTC charts to see where the price could be headed next.
Get started on WEEX with a simple 40 USDT reward. Deposit 100 USDT, make your trade, and claim the bonus.
Analyzing the Charts
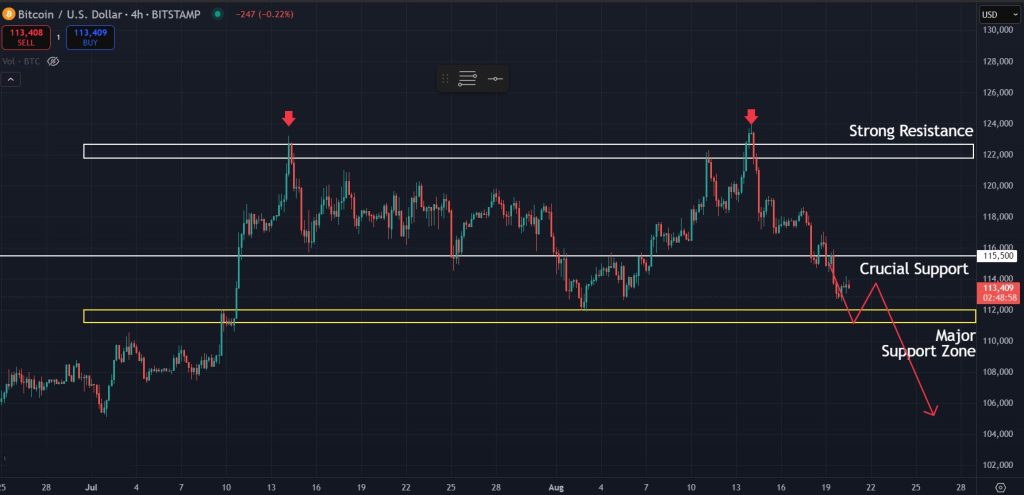
On the 4-hour chart, Bitcoin is trading below the key support at $115,500 and continues to edge lower. The immediate zone to watch now is the area between $112,000 and $111,000, where the price could look to grab liquidity. If buyers step in strongly at this level, it could trigger another leg higher in the short term.
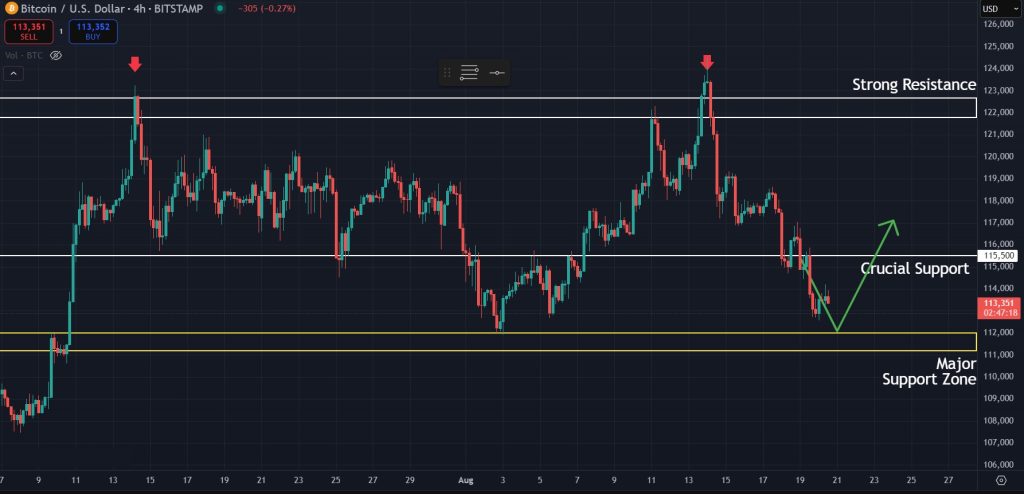
If selling pressure continues and Bitcoin fails to hold the $112,000 zone, a deeper correction could unfold. In that case, the $100,000 level would come into focus, and the key question will be whether buyers can step in with enough strength to absorb the downward pressure.
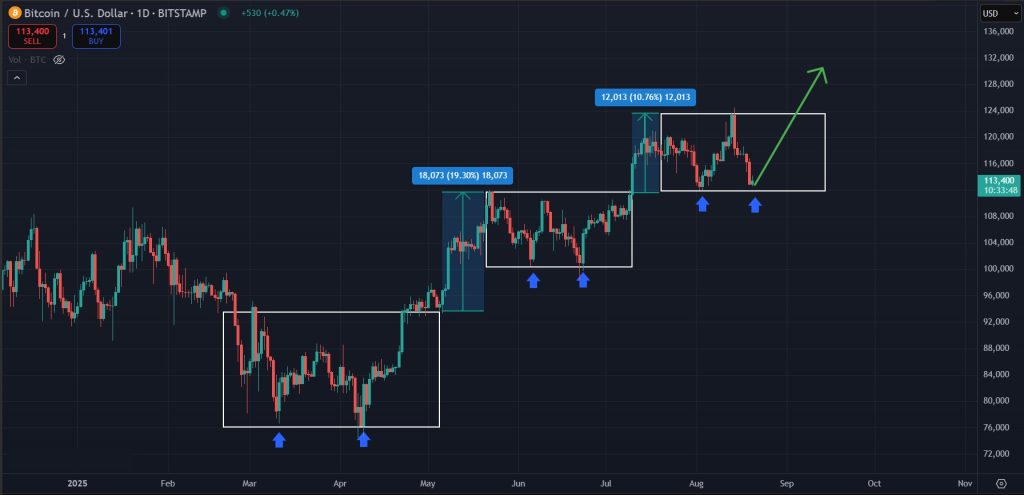
When we shift to the daily chart, the picture becomes a little more constructive. Bitcoin is moving back toward the $112,000 zone, and this level could shape into a double-bottom formation. A double-bottom is a bullish reversal pattern that often forms when the price tests the same support level twice and holds. In this case, Bitcoin has already shown similar behavior twice in recent months, bouncing higher each time after retesting a key support. If the same structure plays out again, the move into $112,000 could act as a liquidity grab before buyers step in, paving the way for another push toward higher targets. This structure cannot be ignored for the short-term Bitcoin price prediction.
Final Takeaway: What is Next for Bitcoin (BTC)?
In conclusion, Bitcoin is still showing weakness in the short term, with $112,000 - $111,000 standing as the decisive zone. If this zone holds, it could mark the third time in recent months that Bitcoin forms a double-bottom before moving higher, keeping the broader bullish structure intact. Failure to defend this level, however, would expose the $100,000 region and signal a deeper correction. The next move around $112,000 will determine whether this trend of repeated rebounds continues or breaks down.
Start trading on WEEX with a 100 USDT deposit and unlock 40 USDT back after completing your first trading step.
Disclaimer: All content on The Moon Show is for informational and educational purposes only. The opinions expressed do not constitute financial advice or recommendations to buy, sell, or trade cryptocurrencies. Trading involves significant risk and may result in substantial losses. Always seek independent financial advice before making investment decisions. The Moon Show is not responsible for any financial losses or decisions made based on the information provided.
Please view the full disclaimer at: https://themoonshow.com/disclaimer

HYPE Drops Toward $60 As Chip Selloff Hits Crypto
HYPE dropped toward $60 on July 17 as a chip-led selloff pulled risk assets lower. The token fe...

ONDO Surges as DTCC Tokenized Stock Push Brings Wall Street Rails Onchain
ONDO became one of the market’s stronger movers after Ondo launched tokenized stock representat...

Chainlink Tests $8.40 As Mantle’s CCIP Move Puts LINK Back In Focus
Chainlink is getting fresh attention after Mantle moved its $2.5B+ Super Portal from LayerZero ...