 Price Analysis: Head and Shoulders Breakdown Points to $3,900 Test")
Ethereum (ETH) Price Analysis: Head and Shoulders Breakdown Points to $3,900 Test
Ethereum is currently trading close to $4,300, but the price action shows weakness on the lower timeframes. In our last Ethereum price prediction, we pointed out that a clean break above $4,000 could spark a move higher. The breakout did take place, and ETH rallied strongly, yet it struggled to push into new all-time highs. This failure to extend the rally is now weighing on momentum, and buyers appear to be losing control. As a result, the market looks set for a short-term correction, and the charts will help us identify which support zones are likely to come into play next. Let’s take a look:
Trade on MEXC without KYC and unlock welcome rewards worth $30,000. Register now and start earning your bonuses from day one.
Analyzing the Charts
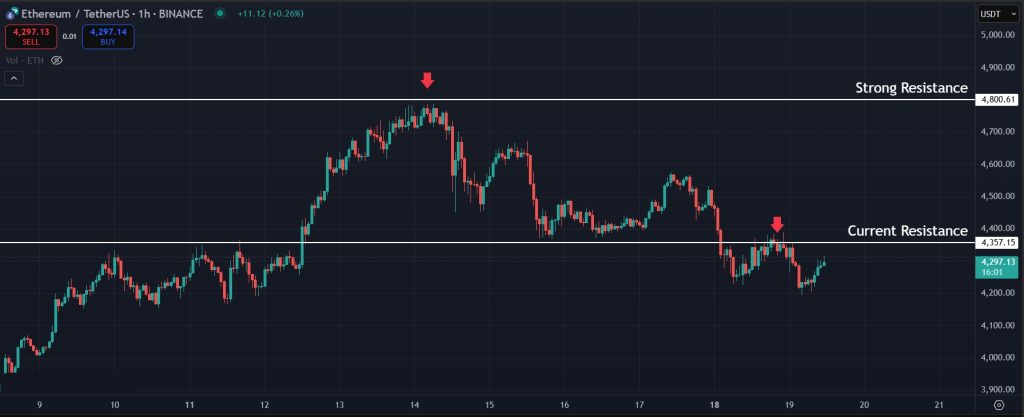
On the 1-hour chart, Ethereum faced strong rejection just under the $4,800 level, which sparked a sell-off and halted its upward momentum. The key support we were watching around $4,350 has already been broken, and the price has now flipped this level into resistance. This shift suggests that sellers are gaining the upper hand in the short term, making it harder for ETH to recover quickly without first reclaiming that zone.
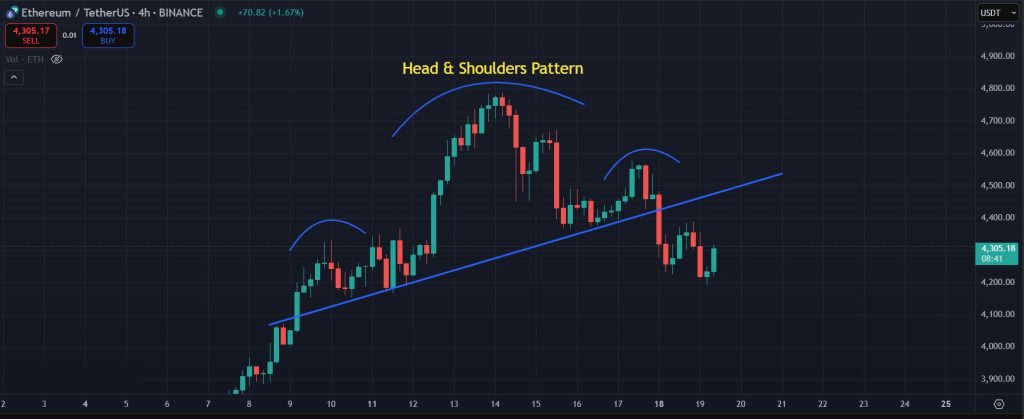
Zooming out to the 4-hour chart, Ethereum has formed a clear head and shoulders pattern. This setup is considered a bearish signal because it often marks the end of an uptrend and the start of a deeper pullback. ETH has already broken below the neckline of this pattern, which confirms the breakdown and points to the possibility of further downside in the near term.
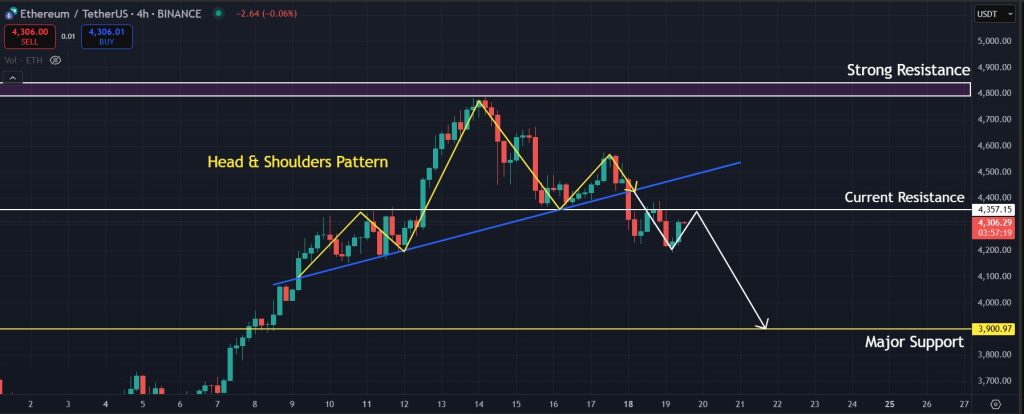
With momentum turning bearish on the lower timeframes, Ethereum is likely to test lower levels. The major support sits around $3,900, a zone that has previously acted as a strong base for price. In the short term, this level could provide stability and attract buyers looking for an entry. How ETH reacts at $3,900 will be crucial. A solid bounce from here could shift momentum back in favor of the bulls and put the market in a position to challenge the highs once again.
Final Takeaway: What is Next for Ethereum (ETH)?
Ethereum is currently trading around $4,300 after losing momentum near $4,800 and breaking below the $4,350 support, which has now turned into resistance. The rejection at higher levels and the head and shoulders breakdown on the 4-hour chart both suggest the market is leaning bearish in the short term. The next major level to watch is $3,900, which has acted as a strong support zone in the past. If Ethereum manages to hold this level and stage a bounce, the market could regain bullish momentum and make another push toward new highs. On the other hand, if $3,900 fails to hold, it would confirm deeper weakness and open the door for a more extended correction. For now, traders should closely monitor how ETH reacts around this support, as it will likely set the tone for the next move.
MEXC makes onboarding simple. Sign up without KYC, trade right away, and claim up to $30,000 in welcome rewards.
Disclaimer: All content on The Moon Show is for informational and educational purposes only. The opinions expressed do not constitute financial advice or recommendations to buy, sell, or trade cryptocurrencies. Trading involves significant risk and may result in substantial losses. Always seek independent financial advice before making investment decisions. The Moon Show is not responsible for any financial losses or decisions made based on the information provided.
Please view the full disclaimer at: https://themoonshow.com/disclaimer

HYPE Drops Toward $60 As Chip Selloff Hits Crypto
HYPE dropped toward $60 on July 17 as a chip-led selloff pulled risk assets lower. The token fe...

ONDO Surges as DTCC Tokenized Stock Push Brings Wall Street Rails Onchain
ONDO became one of the market’s stronger movers after Ondo launched tokenized stock representat...

Chainlink Tests $8.40 As Mantle’s CCIP Move Puts LINK Back In Focus
Chainlink is getting fresh attention after Mantle moved its $2.5B+ Super Portal from LayerZero ...