What is a Bull Flag in Crypto Trading?
Quick Summary: A bull flag pattern is a potential bullish continuation setup: a sharp rally forms the flagpole, followed by a brief consolidation within a roughly parallel channel. Traders assess a breakout above the upper boundary, along with volume and market structure. Identifying the pattern and understanding entry choices, stop placement, target estimation, position sizing, and invalidation are crucial. The pattern can fail, even after a breakout.
Key Takeaways
- A bull flag pattern forms after a sharp advance; consolidation volume typically contracts, while a breakout on rising volume can strengthen the continuation signal.
- A close above the upper boundary is one confirmation method. A retest is optional, and neither guarantees follow-through.
- Define invalidation and position size before entry. A flagpole projection estimates a possible target but doesn’t guarantee a profitable trade.
Traders use a bull flag pattern to assess whether a sharp rally might continue after a brief consolidation. The setup provides reference points for confirmation, invalidation, and estimating targets, but it can fail.
This guide explains how to evaluate the pattern and build a trade plan around it.
What is a Bull Flag Pattern?
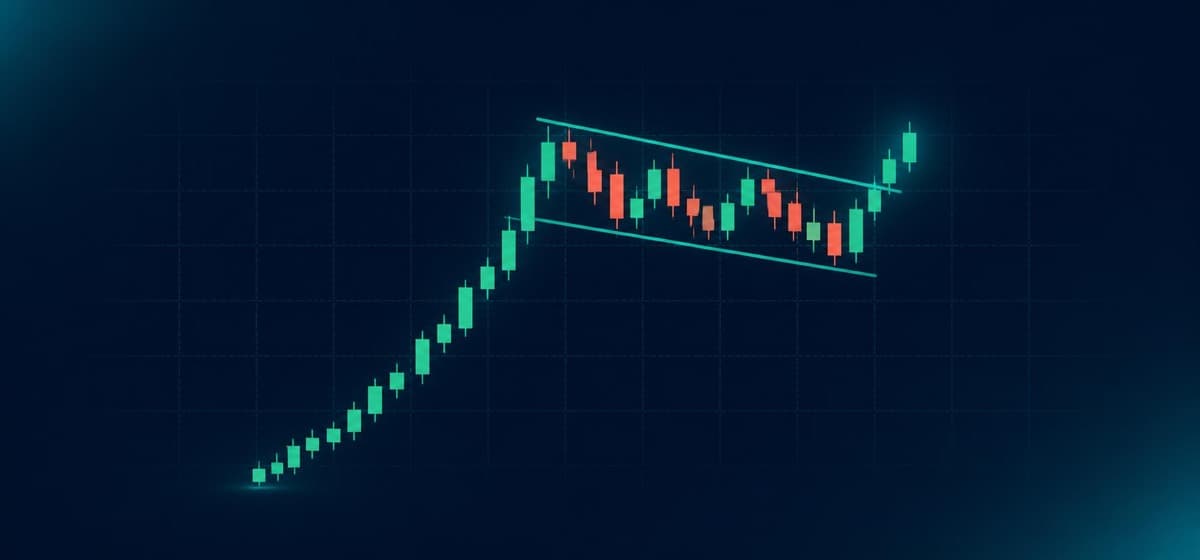
A bull flag is a bullish continuation chart pattern that consists of a sharp price advance, known as the flagpole. It is followed by a brief consolidation within a roughly parallel channel. A breakout above the upper boundary might signal renewed upward momentum.
The pattern has the following components:
- Flagpole: A rapid rise in the price due to strong buying pressure. For instance, suppose Bitcoin (BTC) jumps from $50,000 to $55,000. The $5,000 advance forms the flagpole.
- Flag: A brief consolidation period bounded by a lower support trend line and an upper resistance trend line. This phase can last for days or even weeks on higher timeframes, while it may last for minutes or hours on intraday charts.
- Breakout: It is confirmed when the price closes above the flag’s upper boundary. Stronger volume can support the signal, but the breakout can still fail.
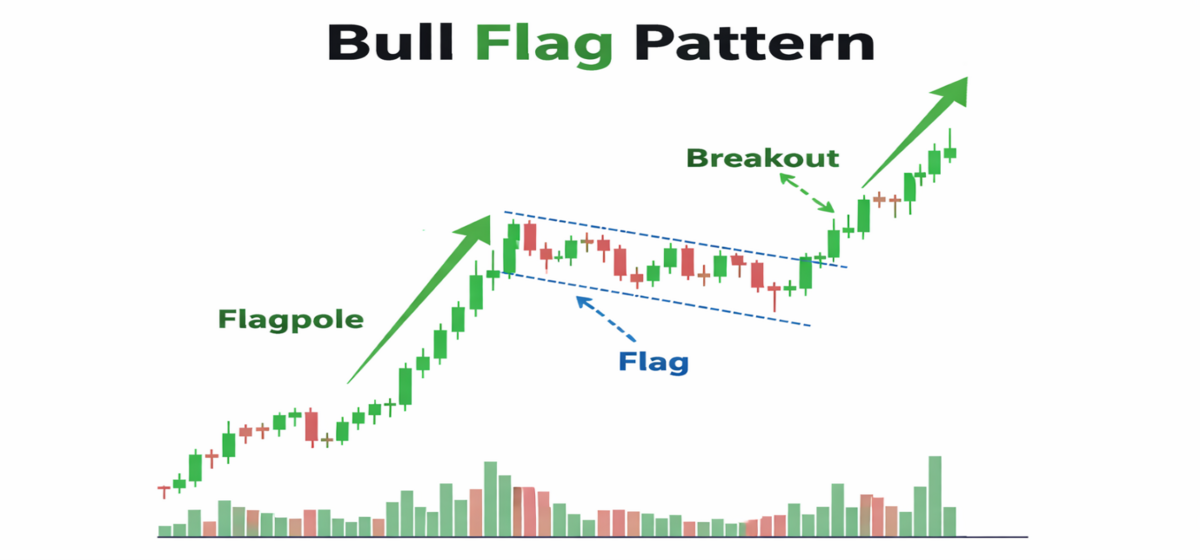
(Bull flag pattern)
Your $30,000 bonus + 10% discount are waiting on Bybit! Sign up and claim these rewards before they’re gone. Time’s ticking!
Market Psychology Behind the Bull Flag Pattern
Traders often interpret the flagpole as strong upward demand and the consolidation as profit-taking or reduced buying pressure.
If selling pressure remains contained and price breaks above the channel, the move may signal renewed demand.
This interpretation remains provisional until subsequent price action supports it.
What Does a Bull Flag Signal? (No Guarantee)
A bull flag pattern has a bullish continuation bias, but the breakout can reverse. Therefore, assess the setup against nearby resistance, liquidity, and the planned reward-to-risk.
Also, as a new trader, always do your own research (DYOR) and avoid relying on a single pattern when trading cryptocurrencies.
Where does the Pattern Appear?
The bull flag pattern appears after a strong impulsive move within a broader uptrend. It can form above a previous resistance level, but it doesn’t require a flip from resistance to support. Nearby higher-timeframe resistance can limit upside.
The pattern becomes less reliable during overlapping price swings without a clear directional trend.
A bull flag can appear on intraday and daily charts. On shorter timeframes, such as 5 or 15 minutes, it requires closer attention to execution costs and brief price fluctuations. Longer timeframes, such as 1 hour or 1 day, show the setup over a broader interval, but the timeframe alone doesn’t determine its probability of success.
How to Spot a Bull Flag Pattern?
To identify a bull flag pattern, you need to follow these steps:
1. Spot an upward movement
The first step in spotting a bull flag pattern is to identify a significant market uptrend. Mark its starting low and ending high so the flagpole measurement can be reproduced.
2. Identify the consolidation channel
Draw roughly parallel boundaries around the consolidation highs and lows. The channel commonly slopes downward, although sideways consolidations are also described as flags. A triangular consolidation with converging boundaries is a pennant.
3. Observe volume changes
During consolidation, volume typically contracts compared with the flagpole. Renewed volume expansion on an upward breakout can support the continuation interpretation.
4. Confirm the pattern
To confirm a bull flag pattern, apply a predefined confirmation rule, like a candle close above the upper boundary on the timeframe used to identify the pattern. An intrabar move above resistance does not satisfy a candle-close rule.
| Key Terms | What it means |
| Flagpole | A steep climb in the price due to rising buying pressure |
| Consolidation | A period in which price trades within a relatively bounded range |
| Continuation pattern | A setup favoring trend continuation |
| Fakeout | A quickly reversed breakout |
How to Trade the Bull Flag Pattern?
After recognizing the bull flag pattern, assess whether the entry, invalidation level, and available upside justify a trade. Waiting for additional confirmation can change the entry price and cause you to miss the move.
Below is a step-by-step guide covering entry-to-exit and practical risk management.
1. Entry signal
Wait for price to move above the flag’s upper boundary instead of rushing into a breakout during consolidation. On higher timeframes, traders look for confirmation, such as a candle closing above resistance, to minimize the risk of a false breakout.
An aggressive approach uses a buy-stop entry above the flag’s upper boundary, which accepts that an intrabar trigger can reverse before the candle closes. A conservative approach is to wait for a breakout candle to close above the boundary.
2. Stop-loss placement
Set the invalidation level before entry. After this, place a stop-loss consistent with that level. For a breakout trade, one approach is to place the stop-loss below the flag’s relevant swing low, allowing a predefined buffer for price fluctuations.
A stop-market order can execute beyond its trigger price. A stop-limit order controls the acceptable execution price but might remain unfilled.
Suppose in a trading setup, a trader might place a stop-loss below the flag low with a predefined buffer. Position size should reflect the entry-to-stop distance and the trader’s chosen account-risk limit.
3. Set profit target
The third significant step is setting the profit target to plan your exit carefully. A common measured-move estimate adds the flagpole’s height to the breakout price. Nearby resistance can justify an earlier planned exit. However, projection is an estimate, not a promise that price will reach it.
4. Define the trade size
Even an ideal bull flag pattern can fail when the market suddenly shifts. So, set your risk budget before entering a bull flag pattern. Always calculate position size using the distance between your entry price and stop-loss, instead of choosing an arbitrary amount to invest.
A commonly used formula for this is:
Position size = Risk budget / (Entry price − Stop-loss price)
Suppose you have $10,000 and choose to risk 1%, or $100, on a Bitcoin (BTC) spot trade. You buy BTC at $54,200 and set a stop-loss at $52,200 per BTC. The difference is $2,000 per BTC.
Position size = $100 / $2,000 = 0.05 BTC
Buying 0.05 BTC at $54,200 costs $2,710. If you sell at the stop price of $52,200, you receive $2,610, for a $100 loss before fees and slippage.
Actual losses might be higher if the stop executes below $52,200.
Remember, the 1% risk budget is a choice, not a universal rule.
5. Observe post-breakout behavior
Once you enter a trade, closely watch how the price maintains the breakout and develops follow-through upward. A retest can occur but is not required.
If price returns inside the flag or breaches the predefined invalidation level, follow the exit rules you set before entry.
What Invalidates a Bull Flag Setup?
A bull flag pattern is considered invalid in the following conditions:
- A breach of the predefined flag low or structural support can invalidate the pattern.
- A breakout that reverses back inside the channel warns that continuation has failed to develop.
- Deep retracements or stronger selling pressure can weaken the interpretation, but neither replaces a defined price-based exit rule.
When the pattern’s conditions are met, execute the planned exit. After this, reassess the structure before considering another entry.
Final Thoughts
A bull flag pattern provides a framework for assessing potential continuation after a sharp advance. Before entry, define the confirmation rule, invalidation level, position size, and target.
Traders should observe the setup by its structure and execution conditions, while accepting that a confirmed breakout can still fail.
FAQs
Does a bull flag pattern need a retest?
No. Price can continue higher without retesting the breakout level. Waiting for a retest is an optional entry method.
How is the bull flag target calculated?
Add the flagpole’s height to the breakout price. This estimates a potential target, not a guaranteed outcome.
What is the bull flag success rate?
There is no universal success rate. Any percentage requires defined trading rules and testing across a specified market, timeframe, and sample.
What invalidates the setup?
Breaching the predefined invalidation level, typically below the flag low, invalidates the trade setup.
How does a bull flag differ from a bull pennant?
A bull flag has roughly parallel consolidation boundaries. A bull pennant has converging boundaries that form a small triangle.
Get started on WEEX with a simple 40 USDT reward. Deposit 100 USDT, make your trade, and claim the bonus.
Disclaimer: All content on The Moon Show is for informational and educational purposes only. The opinions expressed do not constitute financial advice or recommendations to buy, sell, or trade cryptocurrencies. Trading involves significant risk and may result in substantial losses. Always seek independent financial advice before making investment decisions. The Moon Show is not responsible for any financial losses or decisions made based on the information provided.
Please view the full disclaimer at: https://themoonshow.com/disclaimer

Cup and Handle Pattern: Crypto Trading Rules, Targets, and Risks
The cup and handle is a bullish continuation chart pattern that signals a potential upward pric...

How Does Bitcoin Work? Blockchain, Mining, and Wallets Explained
Bitcoin is the world’s first decentralized digital currency that lets people send money directl...

Leverage Trading in Crypto: How It Works, Risks, and Examples
Leverage trading lets crypto traders control larger positions using borrowed funds or derivativ...