
Cup and Handle Pattern: Crypto Trading Rules, Targets, and Risks
Quick Summary: The cup and handle is a bullish continuation pattern featuring a rounded decline and recovery, followed by a smaller consolidation near resistance. Traders look for a volume-supported breakout, set an invalidation level, and estimate an upside target based on the cup’s depth. The setup can fail, so risk management remains essential.
Key Takeaways
- A rounded cup and a smaller handle near resistance form the classic bullish continuation setup.
- A breakout supported by stronger volume strengthens the signal, and a wick above resistance alone provides weaker evidence.
- Use the cup’s depth to estimate a target, then assess the potential reward against the stop distance.
What is a Cup and Handle Pattern?
The cup and handle is a bullish continuation chart pattern that signals a potential upward price movement. William O’Neil explained the pattern in his 1988 book “How to Make Money in Stocks.”
The main parts of the pattern include:
- Cup: A rounded decline and recovery toward the previous high.
- Handle: A shorter, shallower consolidation near the cup’s upper boundary.
- Resistance: The overhead price area traders monitor for a breakout.
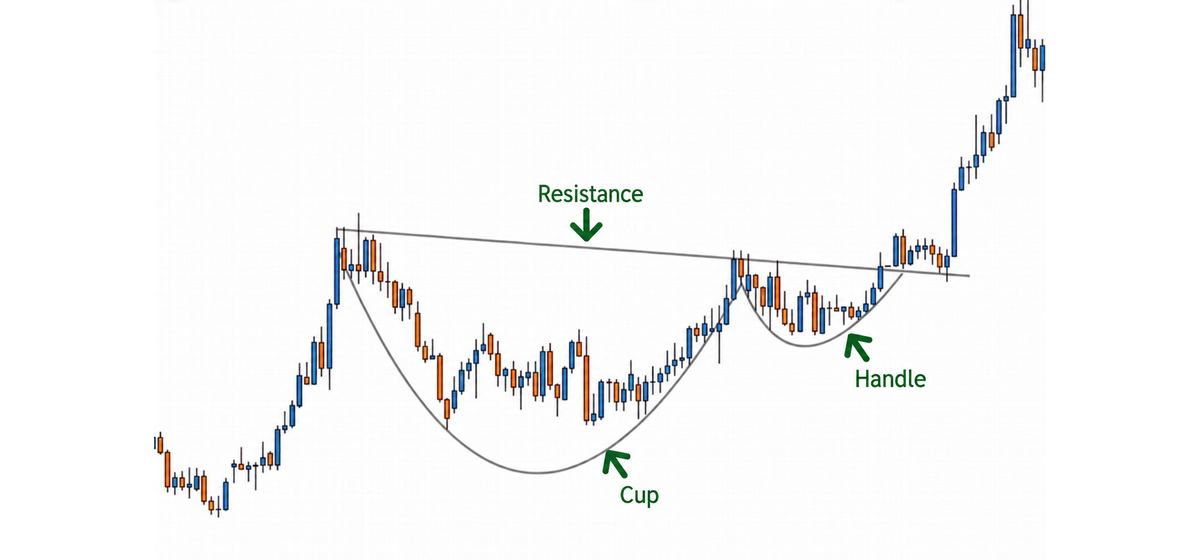
(Cup and Handle Pattern)
Cup and Handle Pattern Types
There are two types of the cup and handle pattern:
- Bullish Cup and Handle: The classic version of the pattern, signaling an uptrend continuation.
- Inverted Cup and Handle: A bearish chart pattern featuring a rounded top, a smaller rebound, and a potential breakdown below support. It may indicate a downtrend continuation or an uptrend reversal, depending on the preceding trend.
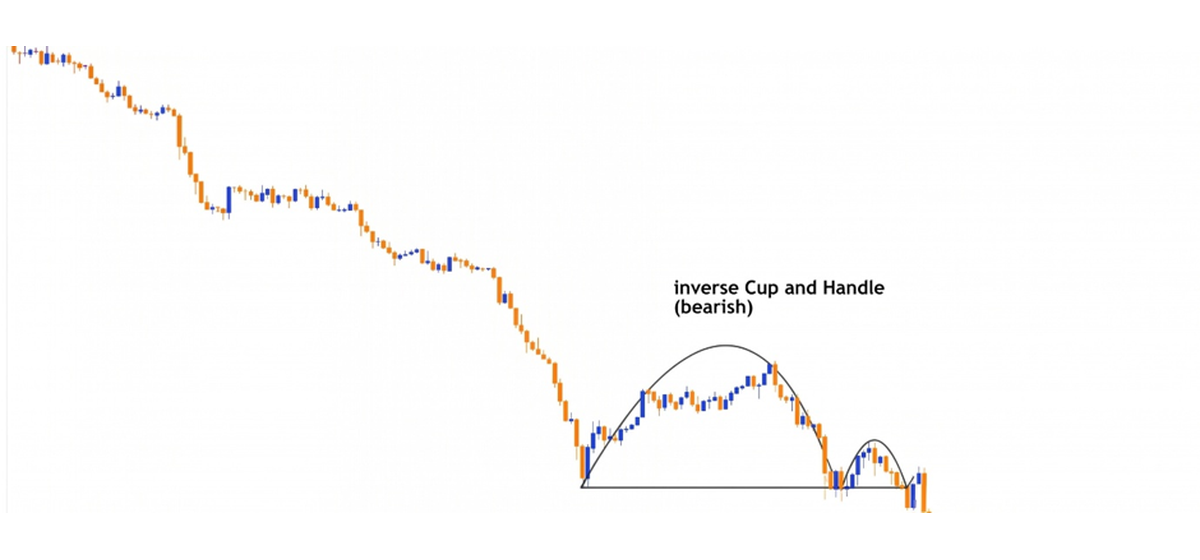
(Inverted Cup and Handle Pattern)
Your $30,000 bonus + 10% discount are waiting on Bybit! Sign up and claim these rewards before they’re gone. Time’s ticking!
How to Identify a Cup and Handle Pattern?
The cup and handle pattern forms in different stages, each of which is crucial to identify:
- The pattern starts with a sustained uptrend, in which an asset’s price rises steadily.
- After reaching a peak, the price pulls back, creating the left side of the cup.
- The decline slows into a rounded bottom before price recovers toward the previous high.
- The price continues to rise as it approaches the resistance line, completing the right side of the cup. This suggests bullish sentiment is returning.
- The price hits the resistance line and pulls back slightly or consolidates after the cup forms.
- The handle slopes downward or moves sideways. It shows a short-term pause as momentum builds.
- A breakout above the selected resistance level activates the setup, although follow-through remains uncertain.
Market Psychology of Cup and Handle Pattern
Traders often interpret the cup as easing selling pressure as demand recovers. The handle represents another pause near resistance.
A breakout might indicate that buyers have absorbed available supply. However, price action alone cannot establish participants’ motives or guarantee continued buying.
Timeframe and Market Context
Crypto traders can identify cup-and-handle structures across different timeframes. Intraday formations might develop within hours or days, while daily and weekly structures can take weeks or months.
Consistently assess the information, breakouts, and invalidations on your selected timeframe. Remember, a longer formation does not guarantee a successful trade.
Confirmation and What to Watch For
Spotting the pattern is step one, but confirming it separates a trade from a guess.
The following key factors are crucial to confirm the pattern:
- Breakout confirmation: A candle close above resistance provides stronger evidence than an intra-bar wick. You can wait for additional closes, which is optional and might produce a later entry.
- Volume behavior: Look for a breakout volume above recent typical levels on the same trading pair and market.
- Retest behavior: The price often pulls back to retest the previous resistance as new support after the initial breakout. A retest that holds or reclaims the breakout level offers another potential entry, although a retest might not occur.
- Fake-out Risks: Illiquid hours can produce exaggerated wicks that trigger stops before a reversal. Therefore, be cautious around news events, macro announcements, or token unlocks that can move price sharply in either direction and cause a temporary breach or a failed breakout.
| Key Terms | What it means |
| Resistance | The price level at which selling pressure outweighs buying pressure |
| Support | The price level at which buying pressure absorbs selling pressure |
| Breakout | A price move beyond an established support or resistance level |
| R-multiple | A trade's profit or loss expressed as a multiple of its initial planned risk |
How to Trade the Cup and Handle Pattern?
Trading the cup and handle pattern requires careful confirmation, a clear entry, a stop-loss, and defined profit targets.
- Entry: An aggressive approach would be to enter the trade as price breaks above resistance. A more selective approach is to wait for a candle to close above that level, ideally with stronger volume, or for a successful retest. A retest might not occur.
- Stop loss: Set your stop-loss below the handle low or, for a retest entry, below the retest low, allowing for normal volatility. Stop execution can involve slippage.
- Profit target: Measure the distance from cup resistance to the cup low, then add it to the resistance level. Treat this measured-move target as a projection.
- Position size: Use your planned monetary risk and entry-to-stop distance to size the position. Compare the potential reward with that risk, accounting for trading costs.
Basic Trade Examples
Assume a Bitcoin (BTC) setup with resistance at $70,000 and a cup low of $60,000. The $10,000 cup depth gives a projected target of $80,000. The handle consolidates between $66,000 and $68,000. It marks a 40% retracement of the recovery, deeper than the preferred one-third guideline but still above the cup’s midpoint.
Aggressive Entry:
As an aggressive trader, you might enter at $70,500 as BTC breaks above resistance, before waiting for a candle close or retest. With a stop-loss placed at $65,000, the planned risk is $5,500.
The potential gain to $80,000 is $9,500, for an approximate 1.73:1 reward-to-risk before costs. Entering before confirmation can expose the position to a breakout that might reverse.
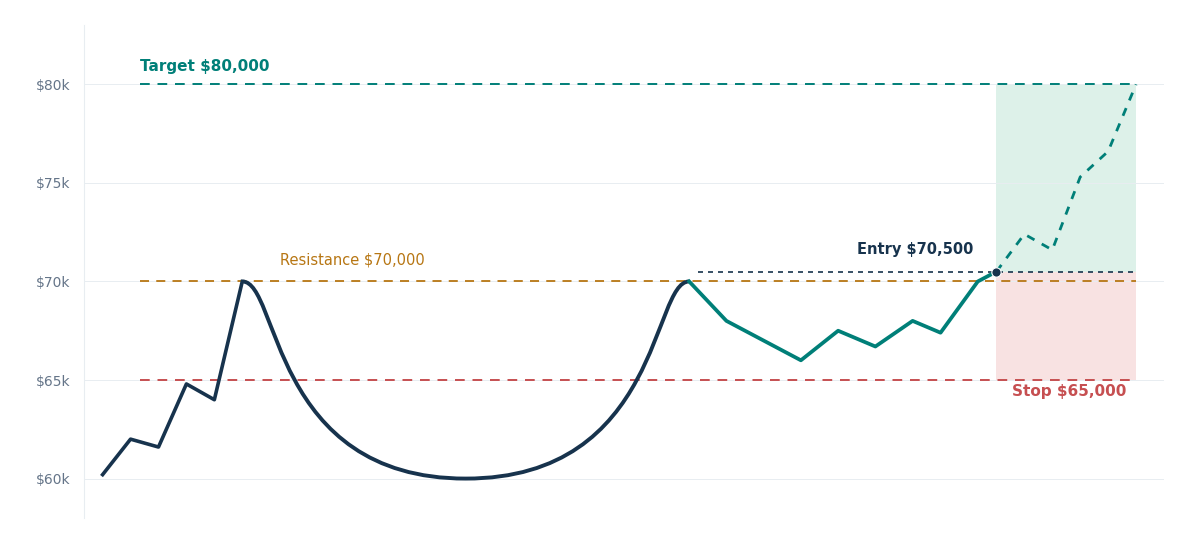
(Aggressive Entry Chart)
Conservative Entry:
In a conservative entry, your emphasis is on confirmation. You wait for a candle close above $70,000, followed by a retest.
BTC briefly dips to $69,000, reclaims resistance, and triggers an entry at $71,000. A stop-loss at $68,000 creates $3,000 of planned risk per BTC against $9,000 of potential reward, giving 3:1 reward-to-risk before costs. The planned loss per BTC is smaller for the same position size, but the trade can still fail.
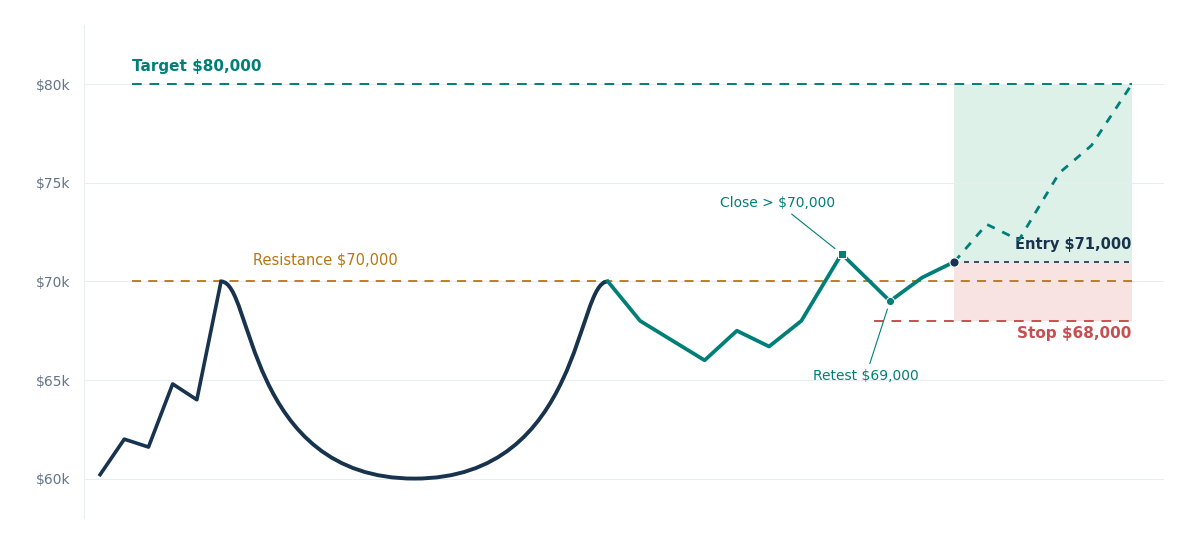
(Conservative Entry Chart)
When Does the Cup and Handle Pattern Become Invalid?
Traders should distinguish weaknesses in the formation from failure after a breakout.
- Before entry: The cup forms a V-shape or is too sharp, the handle extends into the cup’s lower half, or there is no clear resistance level.
- After breakout: A return below resistance suggests a possible false breakout. A breach of the predefined handle or retest invalidation level triggers the planned exit.
- Weak volume: Low breakout volume reduces conviction but does not automatically invalidate the pattern.
In such a scenario, follow the stop-loss established before entry. Avoid widening it simply to keep the trade open, and reassess the structure before considering another position.
Final Thoughts
The cup and handle is a widely used chart pattern in technical analysis that helps identify potential bullish breakouts within an established trend.
The pattern’s usefulness depends on consistent identification, a clear entry trigger, realistic targets, and controlled position sizing.
Therefore, evaluate the complete trade rather than relying on its appearance alone.
FAQs
Is the cup and handle pattern bullish or bearish?
The classic cup and handle is a bullish continuation pattern. It suggests an existing uptrend may resume after price forms a rounded cup, a smaller handle, and a breakout above resistance.
How long does a cup-and-handle pattern take to form?
There is no fixed duration for a cup-and-handle pattern formation. For instance, the pattern might develop over weeks or months on daily or weekly crypto charts. Conversely, it can appear within hours or days on intraday charts.
How reliable is the cup-and-handle pattern in crypto?
The results of a cup-and-handle pattern depend on the asset, timeframe, market conditions, and trading rules. A well-defined structure and stronger breakout volume support the setup, but false breakouts can still occur.
How deep should the handle be?
Ideally, the handle retraces no more than roughly one-third of the cup’s recovery and stays in the cup’s upper half. However, these are just guidelines, not fixed rules.
What invalidates the setup?
A breach of the predefined handle or retest invalidation level invalidates the setup. A return below breakout resistance warns of a possible false breakout.
Get started on WEEX with a simple 40 USDT reward. Deposit 100 USDT, make your trade, and claim the bonus.
Disclaimer: All content on The Moon Show is for informational and educational purposes only. The opinions expressed do not constitute financial advice or recommendations to buy, sell, or trade cryptocurrencies. Trading involves significant risk and may result in substantial losses. Always seek independent financial advice before making investment decisions. The Moon Show is not responsible for any financial losses or decisions made based on the information provided.
Please view the full disclaimer at: https://themoonshow.com/disclaimer

How Does Bitcoin Work? Blockchain, Mining, and Wallets Explained
Bitcoin is the world’s first decentralized digital currency that lets people send money directl...

Leverage Trading in Crypto: How It Works, Risks, and Examples
Leverage trading lets crypto traders control larger positions using borrowed funds or derivativ...
Margin Trading for Beginners: Leverage, Risks, and Examples
Margin trading for beginners starts with understanding how borrowed funds change risk. A small ...