


Quick Summary: A potential double top forms after an uptrend when the price makes two peaks near the same resistance level. A candle that closes below the low between the peaks (the neckline) confirms the pattern. The breakdown signals a possible decline, and the price can still recover.
Crypto rallies often appear unstoppable, but they rarely last forever. The price surges, hits resistance, dips, and then stalls again around the same level. What initially seemed like strength now starts to look shaky. This exact scenario is where the double top pattern proves useful. It allows you to identify buyer exhaustion before a major downturn takes hold.
In this guide to the crypto double top chart pattern, you will learn how the setup develops, how to confirm a breakdown, and why proper risk management is essential.
What is a double top pattern?
A double top is a bearish reversal pattern that usually appears after an upward trend and signals a trend reversal from bullish to bearish.
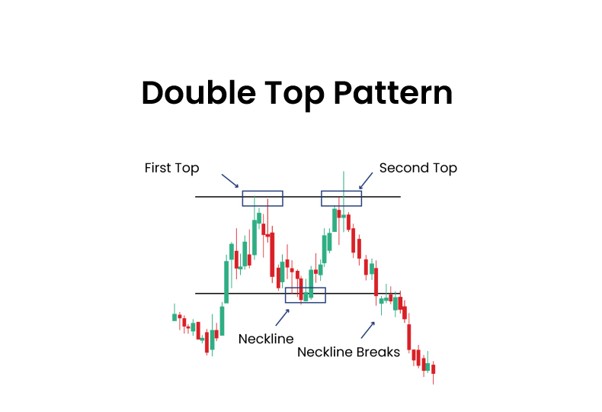
The pattern has two peaks, a trough, and a neckline. The first peak establishes the resistance level. The pullback creates the trough. A second peak then retests that same resistance level and fails to break higher.
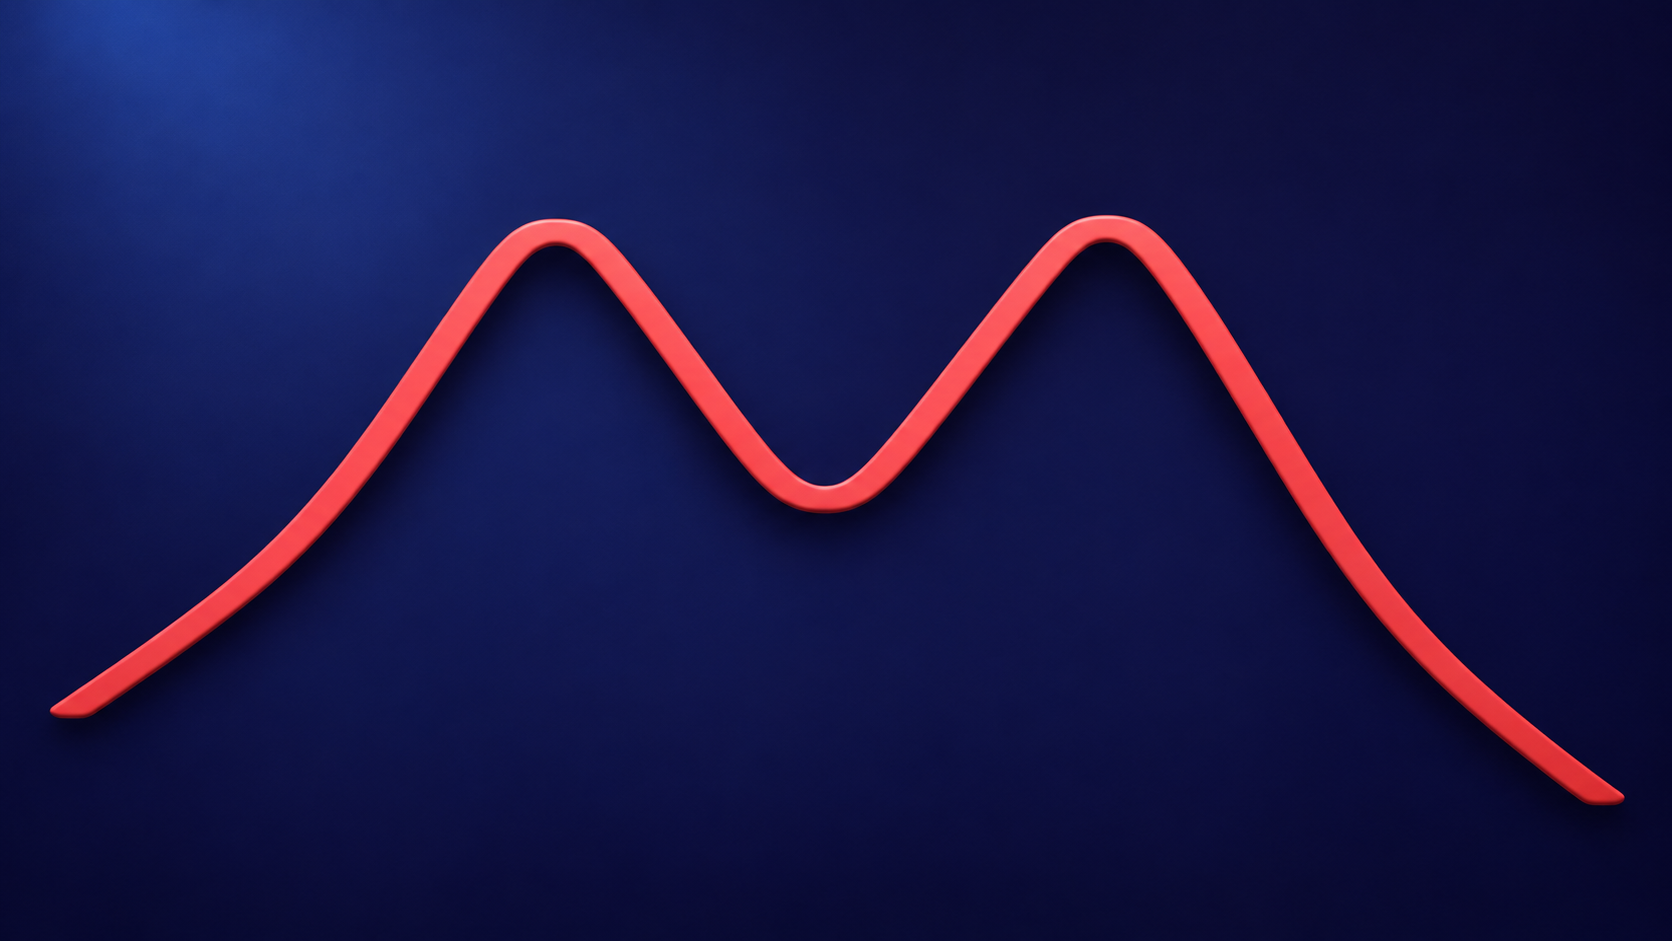
The two highs and the dip between them form an M shape. The bottom of that dip sets the neckline; traders watch for a breakdown at the support level.
Your $30,000 bonus + 10% discount are waiting on Bybit! Sign up and claim these rewards before they’re gone. Time’s ticking!
How to identify a double top
To identify a double top chart pattern, follow this simple workflow:
- Start with the uptrend: Look for prices generally making higher highs and higher lows before the pattern.
- First peak: Mark the high where the first rally stalls.
- Find the pullback low: Draw a horizontal line at the lowest point of the dip between the peaks.
- Mark the second peak: Look for a separate rally that stalls near the first high. A clear dip should separate the two peaks.
- Confirm the breakdown: Wait for a candle to close below the neckline after the second peak. For a four-hour setup, check a four-hour candle. A brief dip below the line can reverse before the candle closes.
What a double top signals
Two stalled rallies suggest the buyers are struggling to push the price higher. A candle close below the neckline shows that selling has pushed through the level where the previous decline stopped.
Lower volume on the second rally or heavier trading during the breakdown can support the signal. Compare the breakdown candle’s volume with recent candles on the same chart, such as ETH/USD spot on a single exchange.
A double top pattern can form on intraday and daily charts. A double top on a four-hour chart can occur during a broader daily uptrend.
Important Read: Triple top pattern in crypto and how to trade it
Market psychology behind a double top
A double top pattern signals a clear shift in market sentiment. Twice, buyers attempt to drive the price past a key resistance level. Sellers step in to hold that exact price level twice. Once the price drops below support, momentum often flips in favor of the sellers.
Buyers push price into resistance at the first peak
The first peak forms following a strong upward move. Buyers’ confidence remains high, driving price to a new high. At that point, the price hits resistance. Early buyers begin locking in their profits. At the same time, sellers enter the market to push back. The upward momentum stalls, establishing the pattern’s first major resistance zone.
Sellers start defending the area on the pullback
Following the first rejection, the price falls from resistance and forms a trough. This trough is crucial as it establishes the neckline, the horizontal support line traders draw across the low between the two peaks. Until the price holds above it, the double top pattern stays unconfirmed.
Buyers try again and fail at the second peak
The price bounces off the trough and climbs back toward that same resistance zone. This rebound forms the second peak. The two highs do not have to be identical. They simply need to form around the same price range. If this second peak stalls, comes up slightly short, or shows weaker momentum, it often signals buyer exhaustion.
Sellers take control at the neckline break
The psychological shift occurs once the price drops below the neckline. At that moment, support fails. Buyers who expected another rebound may exit. Meanwhile, sellers may add pressure. The neckline breakdown turns a potential setup into a stronger bearish reversal signal.
How traders use the pattern
Trading a double top requires careful planning around confirmation, invalidation, and risk.
Traders can use the pattern for:
A possible sell or exit signal
Some traders use a double top to reduce exposure to their long positions. If the price drops below the neckline, the setup may signal that bullish momentum is fading. For long crypto holders, this can be a reason to tighten stops, take partial profit, or reassess the position.
A possible short setup
More experienced traders may use this breakdown as an opportunity to open a short position. However, taking this approach involves considerably higher risk, particularly within the crypto market. Volatility, high leverage, thin liquidity, and slippage can quickly transform an otherwise textbook setup into a costly loss.
How to trade a double top
- Plan your entry: Some traders act after the breakdown close. Others wait for a retest, when the price returns to the neckline from below, and look for it to turn down again. The price can keep falling without a retest.
- Stop-loss placement: Setting a stop-loss defines where your trade idea fails. For a short position, a stop can sit above the higher peak or, for a retest trade, above the retest high. A stop-market order can fill at a worse price than its trigger.
- Estimate the target: Subtract the neckline price from the higher peak to find the pattern’s height. After this, subtract that height from the neckline. This measured move gives you an estimated downside target.
- Risk-to-reward ratio: Before you enter a trade, compare the potential profit target with the potential loss. The setup might not offer a strong risk-to-reward ratio if the stop-loss distance is too large and the target is too close. Managing risk carefully helps you avoid weak trades.
Entry after breakdown vs. entry after retest
Both trading strategies can work, but the choice depends on your timeframe, risk tolerance, and plan.
Hypothetical Ethereum (ETH) trade
Suppose you are trading an ETH/USDT double top on the 4-hour chart. Each candle represents four hours.
Suppose ETH peaks at $2,190 and $2,200 with a $2,000 neckline. Subtract $2,000 from $2,200 to get the $200 pattern height. Likewise, subtract $200 from $2,000 to get a $1,800 target.
After the breakdown, ETH bounces to $2,025 and turns lower. A $1,980 short entry and a $2,040 stop give you $60 of planned price risk per ETH.
A $30 risk budget divided by $60 per ETH gives a position size of 0.50 ETH before trading costs. The target is $180 below the entry, so the potential reward is three times the planned price risk. Fees and slippage can reduce the reward and increase the loss.
Important Read: Understanding the Double Bottom Pattern in Crypto Trading
When the double top fails
Before confirmation, a sustained rise above both peaks invalidates a double top pattern. If the price stays between the peaks and neckline, the setup is still pending. After confirmation, a close back above the neckline followed by price holding above it can signal a failed breakdown.
Follow your planned exit if a brief spike triggers your stop.
Final thoughts
A double top pattern is a classic bearish reversal chart pattern that indicates an existing uptrend is losing momentum and may soon reverse into a downtrend. The pattern is characterized by two consecutive peaks of approximately equal height and a moderate trough between them, which indicates significant resistance at a particular level. Before opening a position, check for earlier support between your entry and target. If that support leaves little room for a drop relative to the risk at your stop, you can pass on the setup.
FAQs
What confirms a double top pattern in crypto?
A candle close below the neckline after the second peak confirms a double top. Use the same timeframe you used to spot the two peaks.
Can the second peak be higher than the first?
Yes. A slightly higher second peak can still fit if the rally stalls in the same resistance zone. A sustained move above that zone weakens the setup.
How do you calculate the double top price target?
Measure the price difference between the higher peak and the neckline. Subtract that amount from the neckline price to estimate a downside target.
How does a double top differ from a double bottom?
A double top has two highs after an uptrend and is confirmed by a close below support. A double bottom has two lows after a downtrend and is confirmed by a close above resistance.
How reliable is a double top pattern in crypto?
Results vary by asset, timeframe, liquidity, and trading rules. Test the same entry and exit rules on historical charts for your market and include trading costs.
Sign up on WEEX and roll for a chance to win a share of the $1,000,000 prize pool.