


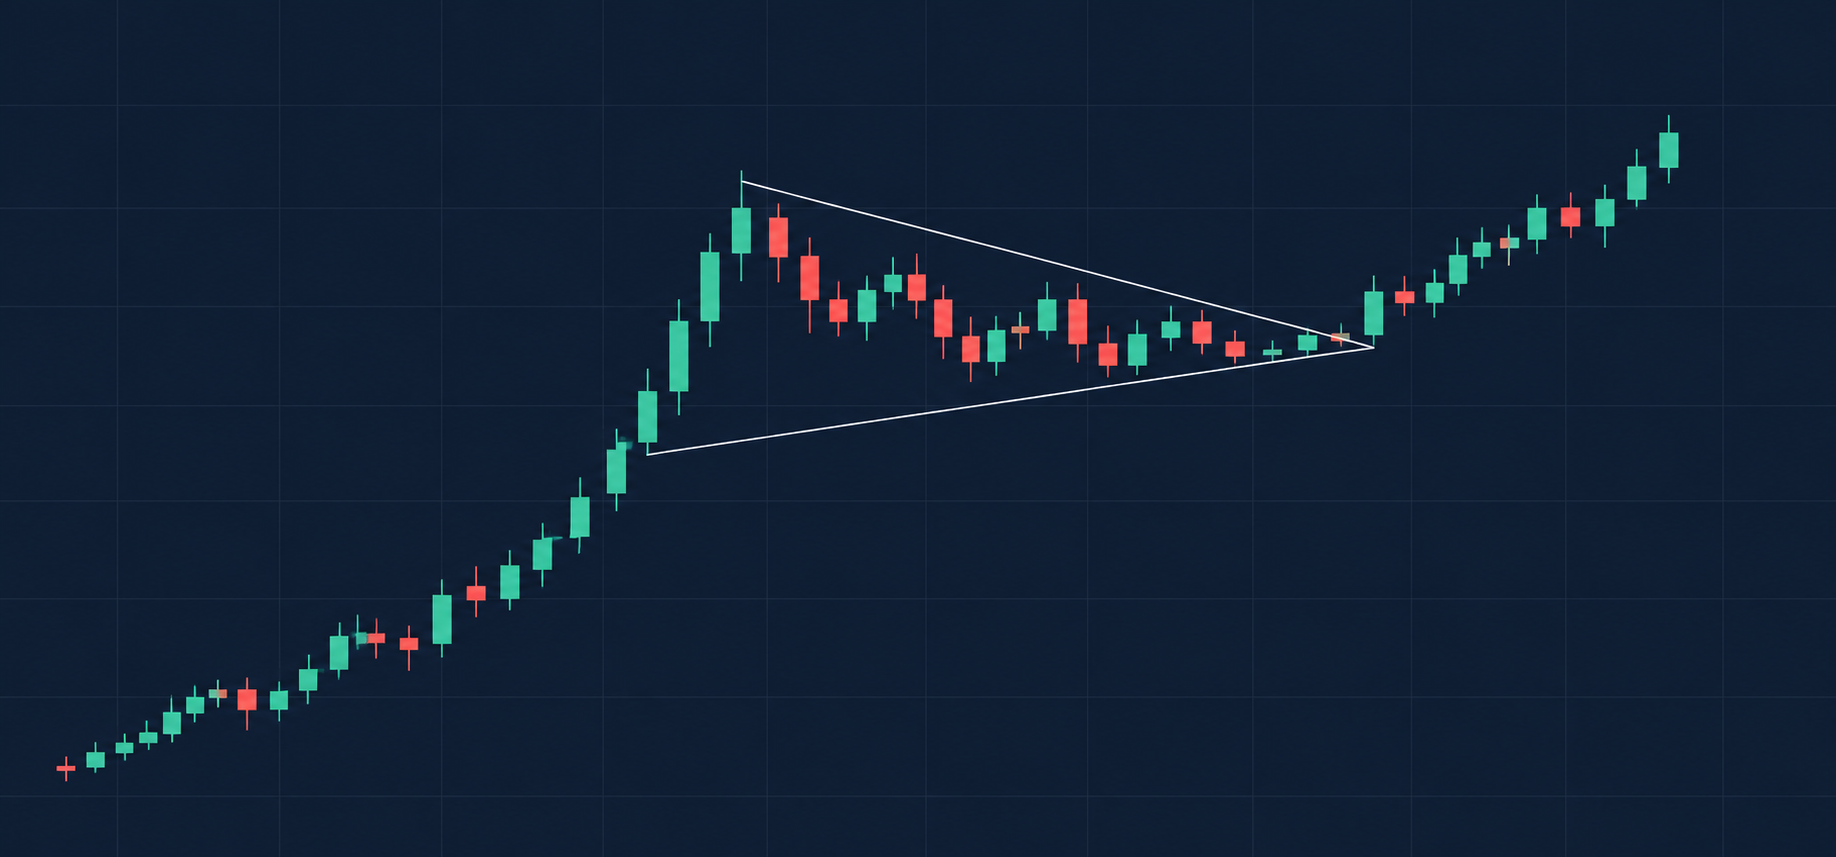
Quick summary: A bull pennant is a bullish continuation pattern that forms when a sharp crypto rally pauses inside converging trendlines. Traders look for a breakout above resistance, assess volume, and plan an entry, stop-loss, and profit target. The flagpole provides a measured-move estimate, but neither the breakout nor the target is guaranteed. Position size should reflect the entry-to-stop distance and a predefined account-risk limit.
A bull pennant is a key chart pattern that helps crypto traders assess potential continuation after a sharp rally. Recognizing the pattern is only the starting point; trading it requires a defined breakout rule, a logical invalidation level, and a position size that limits the planned loss.
This guide explains the pattern’s structure, targets, and risks.
What is a bull pennant pattern?
A bull pennant is a potential bullish continuation pattern that consists of a sharp upward price move, called the flagpole. It is followed by a brief consolidation between converging trendlines, and the flagpole can span several candles.
During consolidation, lower highs and higher lows create a narrowing triangular range. The upper trendline marks resistance, while the lower trendline marks support. The preceding rally gives the setup its bullish continuation interpretation.
Traders look for a breakout above the upper trendline rather than assuming that price will rise when the trendlines meet. Until an upward breakout occurs, the bullish continuation remains unconfirmed.
Your $30,000 bonus + 10% discount are waiting on Bybit! Signup and claim these rewards before they’re gone. Time’s ticking!
How do you identify a bull pennant pattern?
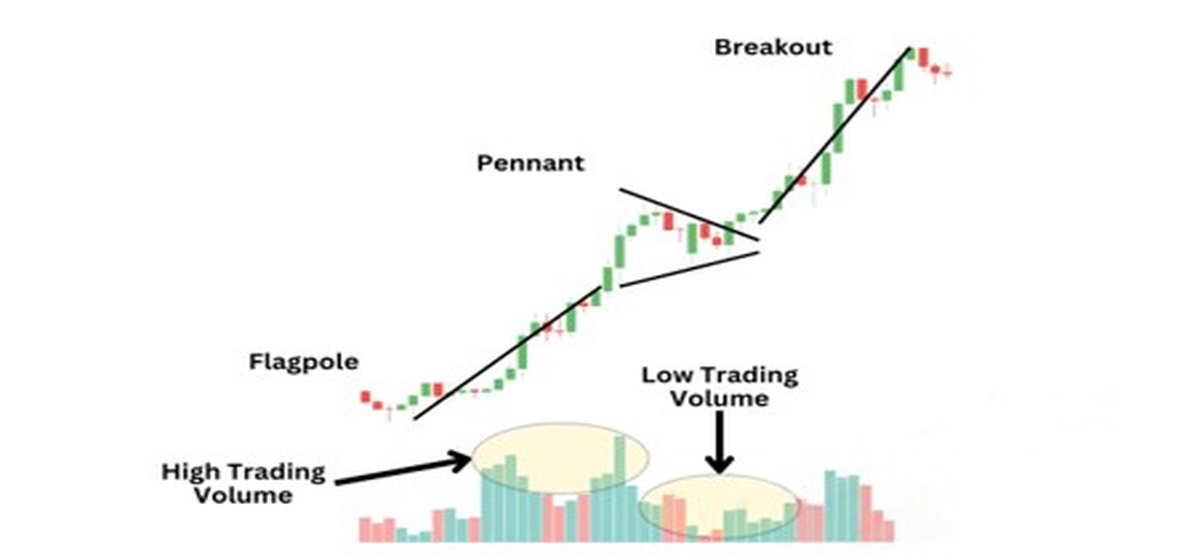
A bull pennant pattern has three key phases that signal an uptrend continuation.
- Flagpole: The first phase begins with asignificant price increase, shown by higher highs and higher lows. This price surge is backed by a noticeable rise in the trading volume, indicating strong buyer interest. The rally demonstrates the initial bullish push that forms the flagpole.
- Pennant: The second phase shows price consolidation within converging boundaries, typically forming lower highs and higher lows. Trading volume often contracts as the range narrows.
- Breakout: The last phase happens when the price breaks above the pennant’s upper trendline. A candle close and increased volume can support a breakout rule, but neither guarantees continued gains.
Psychology of bull pennant formation
One interpretation is that the initial rally slows as buying becomes less aggressive and some holders take profits. Price then trades within a narrowing range as neither side establishes a sustained directional move.
Renewed demand might produce an upward breakout, while stronger selling can produce a breakdown. The chart alone cannot establish participants’ motives or prove that either outcome will occur.
Usual signals and bias
A bull pennant pattern typically carries a bullish continuation bias. The expected outcome is a breakout above the pennant resistance.
However, an upward break can fail even after a candle closes above resistance. Before you enter a trade, define the price that invalidates the trade, the maximum planned account loss, and the conditions for taking profit. Avoid increasing exposure simply because the formation looks bullish.
Where the pennant forms
A bull pennant pattern usually forms within a strong uptrend. Look for a sharp rally followed by a compact triangular consolidation. A triangle without a clear preceding impulse might be better classified as a symmetrical triangle. Before planning a target, check nearby resistance as it might limit the available reward.
The pattern can appear on intraday and daily charts. On a 5-minute or a 15-minute chart, execution costs and brief price fluctuations require closer attention. Hourly and daily charts show the formation over a broader interval. However, timeframe alone does not establish its probability of success. Review the broader trend alongside the chart used for entry.
Important Read: What is a Bull Flag in Crypto Trading?
Trading a bull pennant pattern
To trade cryptocurrencies in a bull pennant pattern, you need to know where to enter, place a stop-loss, and exit the position.
The following steps outline one approach to planning a bullish continuation trade:
- Identify a sharp upward move that forms a distinct flagpole before the consolidation.
- Next, spot a brief consolidation with converging support and resistance trendlines. A roughly parallel consolidation channel is more consistent with a flag.
- One entry method is to wait for a candle to close above the upper trendline on a chosen timeframe. You can enter afterward or wait for a retest, if one occurs. Either approach can fail, so the entry should be evaluated against the stop distance and potential reward.
- One approach is to place the stop-loss below the lowest point of the pennant with a predefined buffer. Another way is to use a relevant support swing. Match your position size to the resulting stop distance rather than moving the stop closer solely to create a larger position.
- A stop-market order can fill beyond its trigger price, so the realized loss might exceed the planned loss.
- Set your take-profit target by projecting the distance of the flagpole upwards from the breakout point.
Listed below are a few examples of trading with a bull pennant pattern:
Aggressive entry
Suppose you are trading SOL/USDT on a 15-minute timeframe chart. SOL forms an aggressive bull pennant, rallying from $90 to $107, then consolidates within a $103-$107 range. When price breaks above the upper trendline at $106, you enter the trade at $106.50 before the candle closes.
A stop-loss at $102, below the pennant low, creates $4.50 of planned risk per SOL. The $17 flagpole projects a target of $123, which is $106+ $17.
The potential reward is $16.50 per SOL, giving a reward-to-risk ratio of approximately 3.67:1 before costs. If you enter before the candle closes, it can expose you to an intrabar breakout that might reverse.
Conservative entry
Suppose you are trading on a one-hour BTC/USDT chart. BTC rallies from $65,000 to $69,500, then forms a pennant with a low of $68,200. At the breakout, upper-trendline resistance is $69,000.
You enter the trade at $69,500 after an hourly candle closes above resistance and place a stop-loss at $68,000. Your planned risk is $1,500 per BTC.
The $4,500 flagpole projects a target of $73,500, which is $69,000 +$4,500. Potential reward from entry is $4,000 per BTC, which produces a reward-to-risk ratio of approximately 2.67:1 before costs. Waiting for the candle close does not eliminate breakout failure.
Note: Remember that position size should reflect your entry-to-stop distance and predefined risk limit.
What invalidates a bull pennant?
A downside break can invalidate the bullish setup. Other changes in volume or structure might demand reassessment without automatically triggering an exit.
Warning signs to reassess
- A candle close below the lower trendline challenges the bullish structure. If price reaches the predefined downside stop level, the stop order triggers according to its conditions. It does not wait for a candle close.
- Expanding volume during the consolidation phase warrants closer examination, particularly when accompanied by falling prices or support breaks.
- If the boundaries do not clearly converge, the formation might not qualify as a pennant.
- Low breakout volume weakens one supporting signal. A subsequent return inside the formation might indicate a failed breakout, depending on your predefined rule.
- If consolidation is prolonged relative to the initial impulse, reassess whether the formation still fits a short continuation setup.
If the pattern turns invalid, follow the exit rule established before entry. Avoid widening the stop or adding exposure simply to avert realizing a loss. After you close a position, reassess the structure before considering another trade. Set the stop-loss and take-profit target before or when entering the position.
Important Read: Cup and Handle Pattern: Crypto Trading Rules, Targets, and Risks
Final thoughts
A bull pennant pattern offers a framework to analyze a pause after a sharp rally. The pattern’s practical value depends on clearly defined entry rules, invalidation, position sizing, and execution costs. A breakout can fail, and a measured target might remain unreached even when the formation is correctly identified.
FAQs
Is a bull pennant bullish or bearish?
A bull pennant has a bullish continuation bias as it follows a sharp rally, but it can break downward or fail after an upward breakout.
How is the bull pennant target calculated?
Add the flagpole height to the breakout price on a linear price scale. However, the result is an estimate.
Does a bull pennant need a retest?
No. A retest is an optional entry condition and might never occur.
What invalidates a bull pennant?
A downside break challenges the bullish structure. Define the precise trendline, swing low, or stop level used to invalidate the trade before entering.
How does a bull pennant differ from a bull flag?
A bull pennant has converging trendlines, while a bull flag has approximately parallel boundaries.
Sign up on WEEX and roll for a chance to win a share of the $1,000,000 prize pool.