


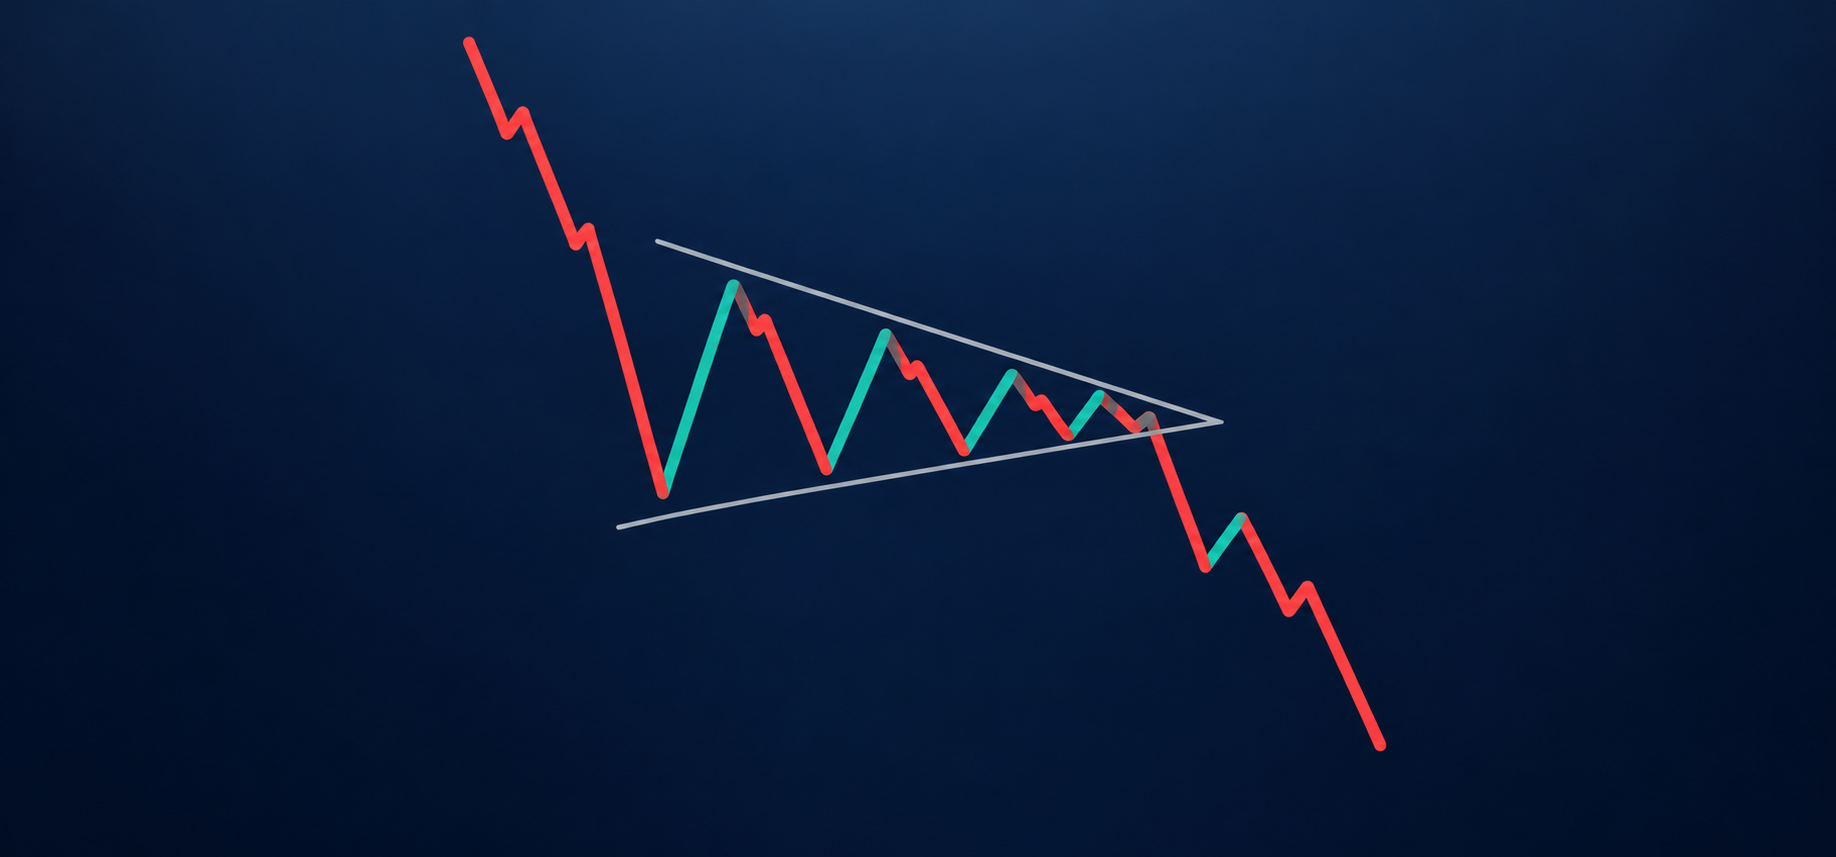
Quick summary: A bear pennant pattern forms when a sharp price drop is followed by a small triangle of narrowing price swings. A break below the triangle can signal another decline. Traders use the initial drop to estimate a target. However, false breakdowns can occur, so planning the stop-loss and position size matters.
Recognizing a triangle after a sharp price drop is only the first step. It is essential to check how the bear pennant pattern formed, whether support breaks, and how much traders could lose if the trade fails.
This guide explains how to identify a bear pennant, assess a breakdown, estimate a target, and manage a failed setup.
What is a bear pennant pattern?
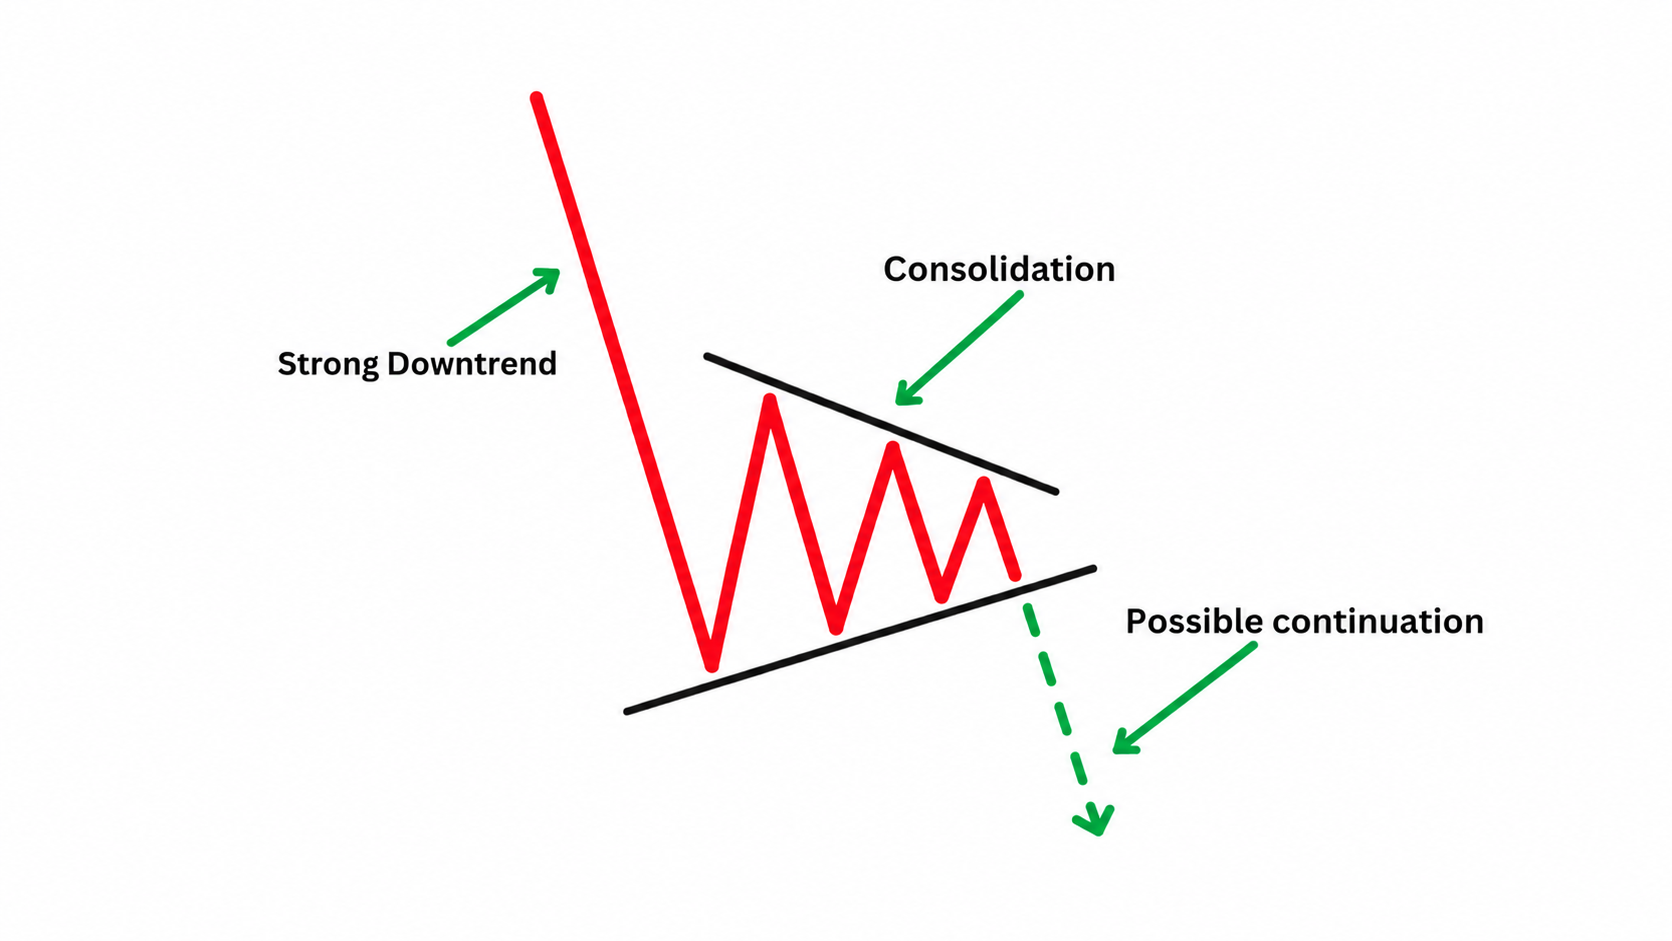
A bear pennant is a downtrend continuation chart pattern. It forms after a sharp price decline, called the flagpole. It is followed by a brief period of smaller price swings, called consolidation.
During the pause, lower highs and higher lows form two converging trendlines. The upper line acts as resistance, while the lower line acts as support. A break below support signals a possible continuation of the decline.
Your $30,000 bonus + 10% discount are waiting on Bybit! Sign up and claim these rewards before they’re gone. Time’s ticking!
How to spot a bear pennant pattern?
Identifying a bear pennant pattern becomes easy for traders when they understand its structure. First, look for a sharp price drop that forms the flagpole, often accompanied by higher trading volume.
Next, traders need to look for smaller price swings between two converging trendlines. The upper resistance line connects lower highs, while the lower support line connects higher lows. Trading volume often falls during this consolidation.
Finally, look for price to break below the lower trendline. Here, higher volume supports the possibility of another decline, but price can still reverse.
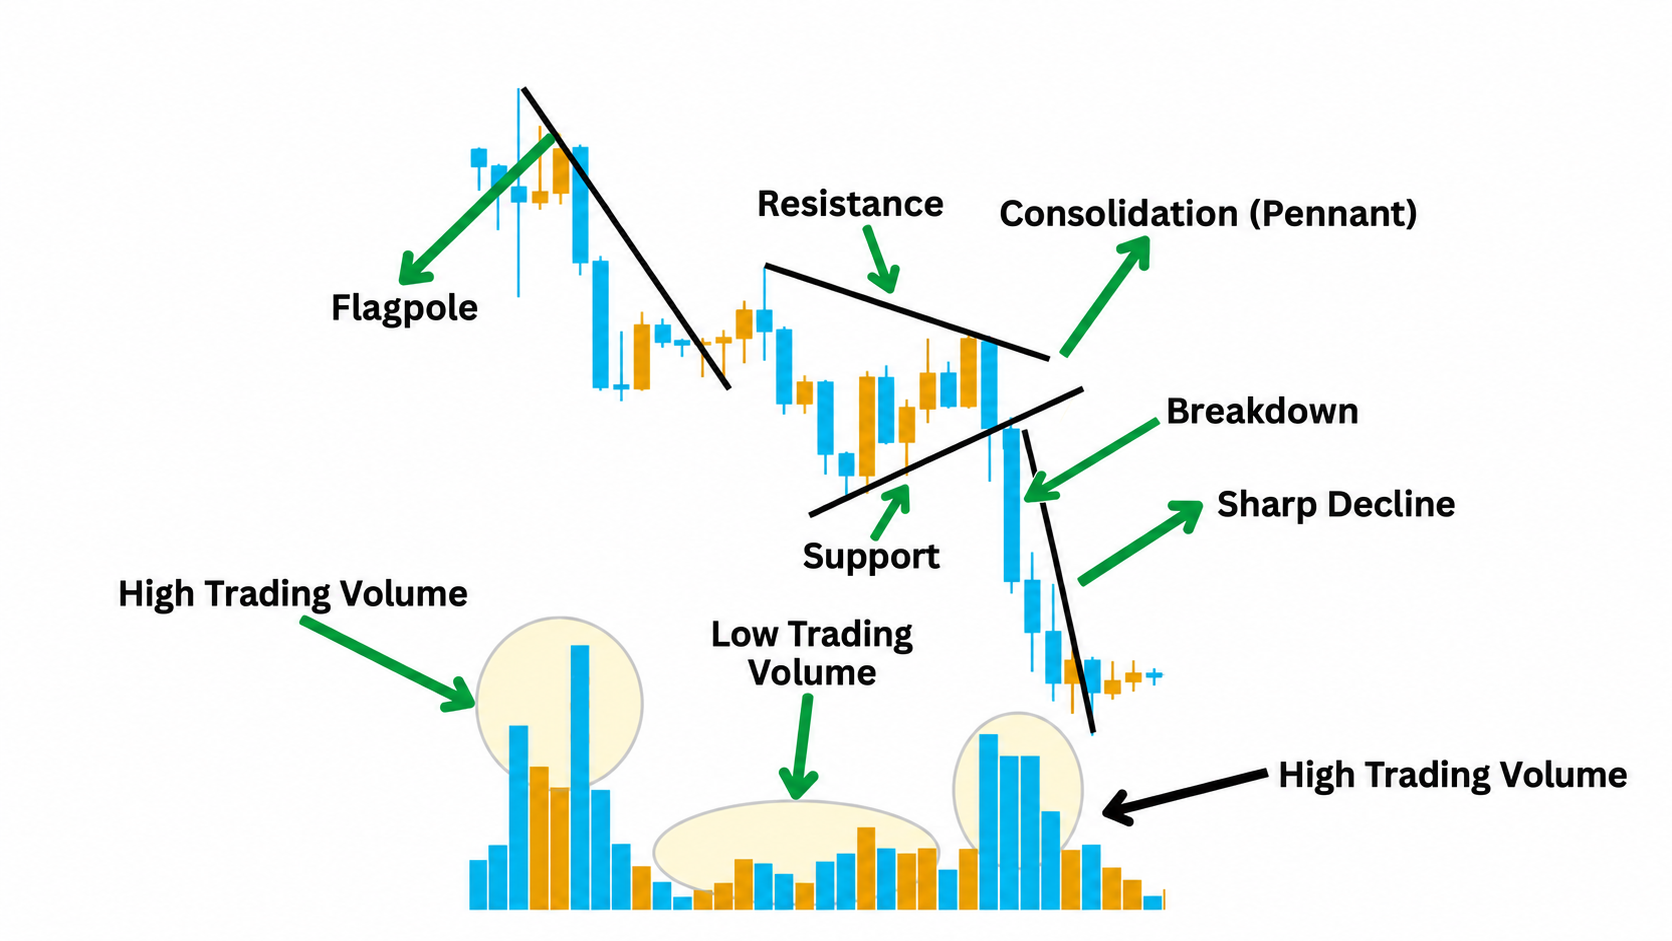
A bear pennant pattern can appear on intraday and daily charts. For instance, on a 15-minute chart, each candle represents 15 minutes, and on a daily chart, each candle represents one day. Use the selected timeframe consistently when drawing the pattern and checking a candle close.
Note: No timeframe removes the risk of a false breakdown.
Bear pennant checklist
Before entering a trade, check the following:
- Flagpole: A sharp price decline appears before the triangle.
- Shape: Lower highs and higher lows create two converging trendlines.
- Volume: Trading activity generally falls during the consolidation phase.
- Breakdown: A candle closes below support on the timeframe you are trading.
- Supporting evidence: Volume increases during the breakdown.
These conditions support the pattern, but the setup can still fail.
Also, check the volume source. Volume represents trading activity of a selected trading pair, not all crypto trading. So, compare the breakdown volume with recent volume on the same chart.
Market psychology of bear pennant pattern
A bear pennant pattern is often viewed by traders as a pause after strong selling. As the market consolidates, price swings become smaller, but the triangle alone does not show which direction will come next.
A break below support on rising volume suggests renewed selling pressure. If the price instead breaks above resistance, the expected bearish continuation has not developed.
What does a bear pennant suggest?
A bear pennant pattern suggests that the earlier decline can continue after the pause. Traders watch for a break below support as evidence that selling has resumed.
However, the pattern can still fail. If the price breaks below the pennant and then moves back inside it, it is a false breakdown.
Waiting for a candle close and checking volume can provide more evidence before entry. Remember, even a closed candle below support can be followed by a reversal.
Important Read: Understanding the Double Bottom Pattern in Crypto Trading
key terms explained
How to trade a bear pennant?
Traders can use a bear pennant to plan short positions, which aim to profit when price falls. Short selling generally involves margin trading or derivatives. Therefore, always check the product’s fees, borrowing or funding charges, and liquidation rules before trading.
When trading with leverage, the exchange can forcibly close a position if the money backing it falls below the required amount. This is called liquidation.
The following tips can help you trade crypto with a bear pennant:
- Identify the flagpole: Look for a sharp price drop immediately before the consolidation.
- Draw the pennant: Connect the lower highs and higher lows with two trendlines. The price swings should narrow as the lines move closer together.
- Plan the entry: One approach is to wait for a candle close below the pennant’s support line before opening a short position. A move below support during an unfinished candle can reverse before the candle closes. Some traders wait for price to return to the broken support and turn down again, although this retest might never happen.
- Set the stop-loss: For a short position, one approach is to place the stop-loss above the pennant’s highest point. This allows room for normal price swings. Remember that a stop-loss helps manage risk and does not guarantee the exit price.
- Choose the position size: Decide how much money you are prepared to risk before entry. After this, choose the amount of crypto to trade based on the distance between your entry and stop-loss. A wider stop-loss requires a smaller position to keep the same planned risk.
- Estimate the target: Measure the flagpole from the start of the sharp price decline to its low. Subtract that distance from the price where support breaks. However, this is a planning estimate. The price can reverse before reaching it, so check for nearby support that could interrupt the decline.
Listed below are two hypothetical examples of trading with the pattern and exclude trading fees, borrowing or funding charges, and slippage.
Breakdown entry
Suppose you are trading BTC/USDT on a 15-minute chart. BTC falls from $55,500 to $52,200, and creates a $3,300 flagpole. It then forms a pennant with a high of $53,000. Near the end of the pattern, support is at $52,400.
A 15-minute candle closes below support, and you open a short position at $52,300 with a stop-loss at $53,100. The estimated target is $49,100 ($52,400 - $3,300).
The planned risk is $800 per BTC, while the potential reward is $3,200 per BTC before costs. The trade can still lose.
Retest entry
Suppose you are trading ETH/USDT on an hourly chart. ETH falls from $2,250 to $2,100 and creates a $150 flagpole. It then forms a pennant with a high of $2,180 and support near $2,130.
After an hourly candle closes below support, price returns to $2,130 and turns down. You open a short position at $2,125, place a stop-loss at $2,190, and estimate a target of $1,980 ($2,130 − $150).
Waiting for a retest provides another condition for entry, but the trade can still fail.
Important Read: Understanding the Falling Wedge Pattern in Crypto Trading
When does a bear pennant pattern fail?
A trader needs to reassess the bearish setup when price moves against the expected breakdown.
- Before entry: When price closes above the upper trendline instead of breaking support, it shows that the bearish entry condition has not occurred.
- After a breakdown: If price closes back inside the pennant, it suggests the move might be a false breakdown.
- Above the pennant high: If price moves above this level, it provides stronger evidence against the short setup.
Low breakdown volume is a warning, but it does not automatically invalidate the pattern. Recheck the pattern if the consolidation becomes larger or price recovers a large part of the initial drop.
The following tips can be helpful in such situations:
- Follow the stop-loss and exit conditions you set before entering a trade.
- Avoid increasing leverage or adding to a losing trade to recover the loss.
- Do not move the stop-loss farther away simply to keep the position open.
- Reassess the chart before considering opening another position.
Final thoughts
A bear pennant pattern can help traders plan short positions after a sharp price decline. Check the breakdown, estimate the target, set the stop-loss, and choose your position sizing before entering. If the setup fails, follow the exit plan and reassess the chart before you open another trade.
FAQs
Is a bear pennant bullish or bearish?
A bear pennant is a bearish continuation pattern, which means that the earlier price decline might resume after consolidation.
How is a bear pennant different from a bear flag?
A bear pennant has converging trendlines that form a triangle, while a bear flag has roughly parallel trendlines, forming a channel.
Can a bear pennant fail after a candle closes below support?
Yes. A bear pennant can fail if price reverses after the candle closes and returns inside the pennant.
How do you calculate a bear pennant target?
Measure the initial price drop and subtract that distance from the price where the pennant’s support breaks.
Sign up on WEEX and roll for a chance to win a share of the $1,000,000 prize pool.