 Price Analysis: Key Levels to Watch as Market Awaits Breakout")
Ethereum (ETH) Price Analysis: Key Levels to Watch as Market Awaits Breakout
Ethereum is currently trading just above the $4,500 mark and has been moving sideways for the past couple of weeks. As mentioned in our previous analysis, there is bearish divergence for ETH on the weekly timeframe, which is why the price is struggling to gain momentum and is hinting at a move toward the downside. However, there are also some positive signs for the leading altcoin, and the price could see renewed strength in the coming weeks. Let’s take a quick look at the latest price charts to see where ETH could be headed in the short term.
Our Ethereum Price Prediction Key Thoughts
- Ethereum is consolidating around $4,500 with resistance at $4,600 and key support near $4,480.
- A symmetrical triangle on the daily chart signals a potential breakout in either direction.
- A move above $5,000 could turn momentum bullish, while a drop below $4,250 risks deeper correction.
Get started on WEEX with a simple 40 USDT reward. Deposit 100 USDT, make your trade, and claim the bonus.
Analyzing the Ethereum Charts
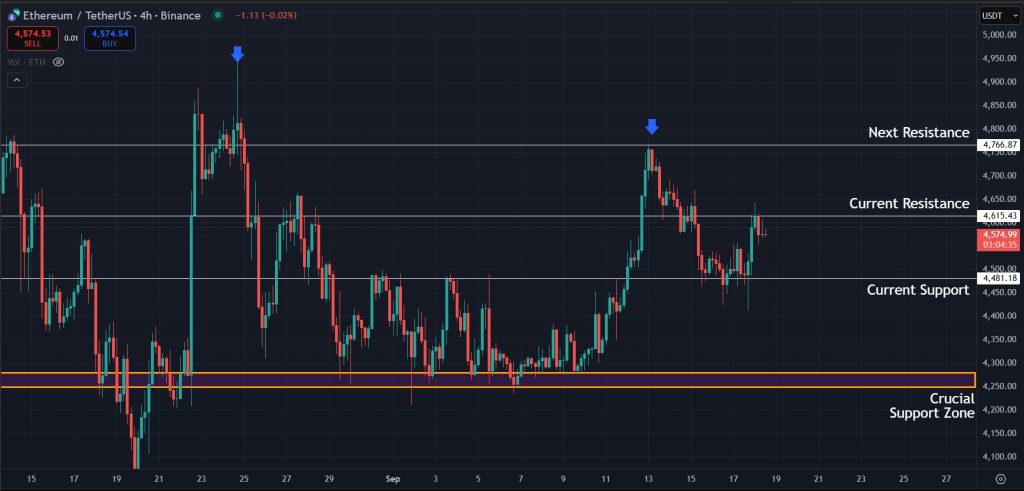
If we look at the latest 4-hour charts for Ethereum, we can see that the price is currently facing resistance at $4,600 and could soon drop to the support at $4,480 once again. The structure also shows signs of a higher low, pointing to weakness in the trend and a possible bearish shift. If ETH fails to hold $4,480, the price will likely move toward the major support zone around $4,250, which has continued to hold firm during this consolidation phase.
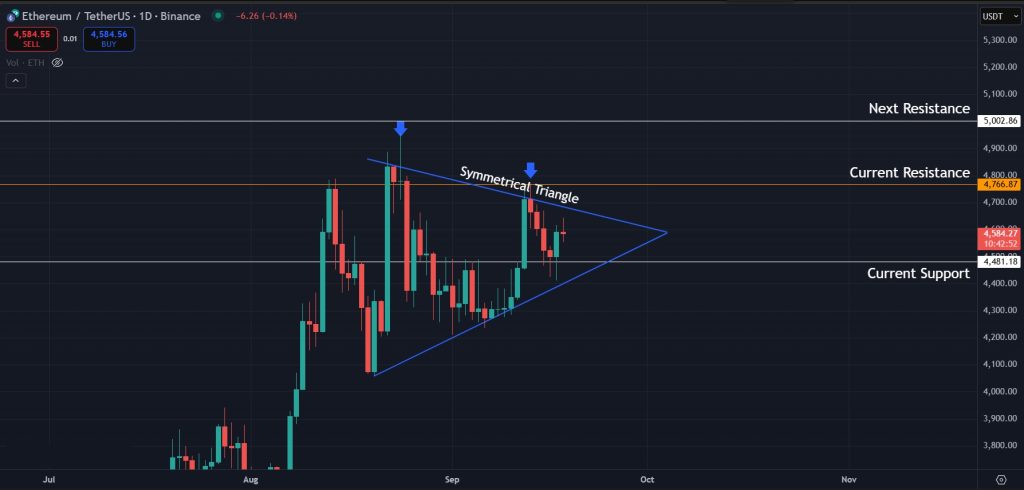
Switching to the 1-day timeframe, the price is forming a symmetrical triangle pattern and is being squeezed toward the middle of this structure. A symmetrical triangle is considered a neutral pattern, meaning the price can break in either direction. If the breakout happens to the upside, the short-term Ethereum price prediction will start leaning bullish. However, a break to the downside would likely trigger a correction.
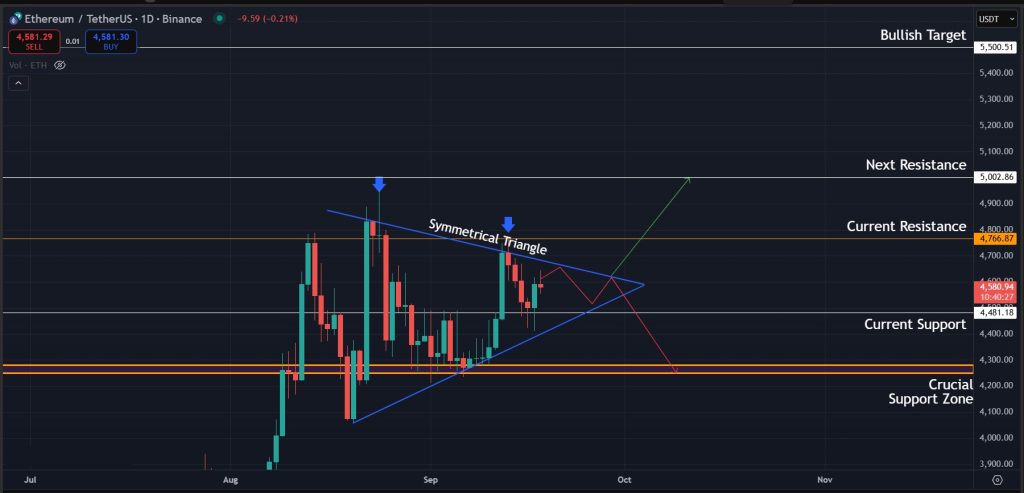
For the bulls to stay in control, ETH needs to break above this structure in the coming days. A successful breakout would open the way toward $5,000, where the price is likely to encounter resistance, with an extended target around $5,500. If the pattern breaks to the downside instead, ETH will be looking at support near $4,250, followed by the $3,900 zone.
Final Takeaway: What is Next for Ethereum (ETH)?
Ethereum is trading around $4,500 and has been consolidating for several weeks. The formation of lower highs on both the 1-day and 4-hour charts points to the possibility of a correction following the recent rally. At the same time, momentum has not fully faded, and the symmetrical triangle pattern leaves room for a potential move toward $5,000. For now, ETH remains in a neutral zone, making it important to watch price action closely and wait for clear confirmations before anticipating the next major move.
Start trading on WEEX with a 100 USDT deposit and unlock 40 USDT back after completing your first trading step.
Disclaimer: All content on The Moon Show is for informational and educational purposes only. The opinions expressed do not constitute financial advice or recommendations to buy, sell, or trade cryptocurrencies. Trading involves significant risk and may result in substantial losses. Always seek independent financial advice before making investment decisions. The Moon Show is not responsible for any financial losses or decisions made based on the information provided.
Please view the full disclaimer at: https://themoonshow.com/disclaimer

HYPE Drops Toward $60 As Chip Selloff Hits Crypto
HYPE dropped toward $60 on July 17 as a chip-led selloff pulled risk assets lower. The token fe...

ONDO Surges as DTCC Tokenized Stock Push Brings Wall Street Rails Onchain
ONDO became one of the market’s stronger movers after Ondo launched tokenized stock representat...

Chainlink Tests $8.40 As Mantle’s CCIP Move Puts LINK Back In Focus
Chainlink is getting fresh attention after Mantle moved its $2.5B+ Super Portal from LayerZero ...