 Price Analysis: Key Levels to Watch as Market Signals Downside Risk")
Ethereum (ETH) Price Analysis: Key Levels to Watch as Market Signals Downside Risk
Ethereum is currently hovering around $4,300 and moving slowly on the lower timeframes. As highlighted in our previous analysis, ETH is being squeezed toward $4,250, consistently forming lower highs. While bulls have held the $4,250 support well, they haven’t managed to drive any significant upside momentum. With price struggling to break higher and volume lacking, further downside looks likely for ETH in the short term. Let’s take a look at the latest Ethereum charts to see where the price may head in the coming days.
Get started on WEEX with a simple 40 USDT reward. Deposit 100 USDT, make your trade, and claim the bonus.
Analyzing the Ethereum Charts
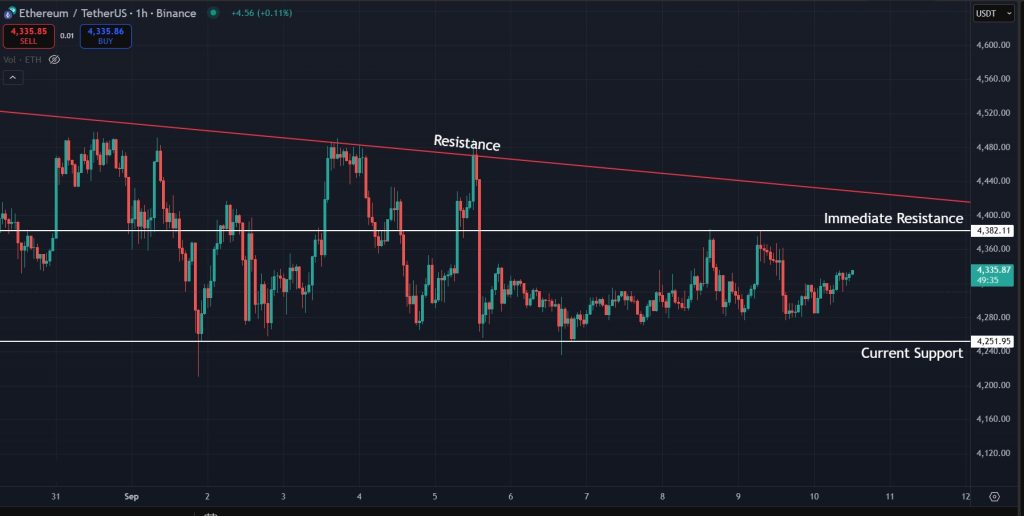
If we take a look at the latest 1-hour charts for ETH, we can see that the price is holding the $4,250 mark but struggling to gain any momentum from this level. There is clear trendline resistance forcing the price to form lower highs, along with horizontal resistance just below $4,400. This area has acted as both support and resistance in the recent past.
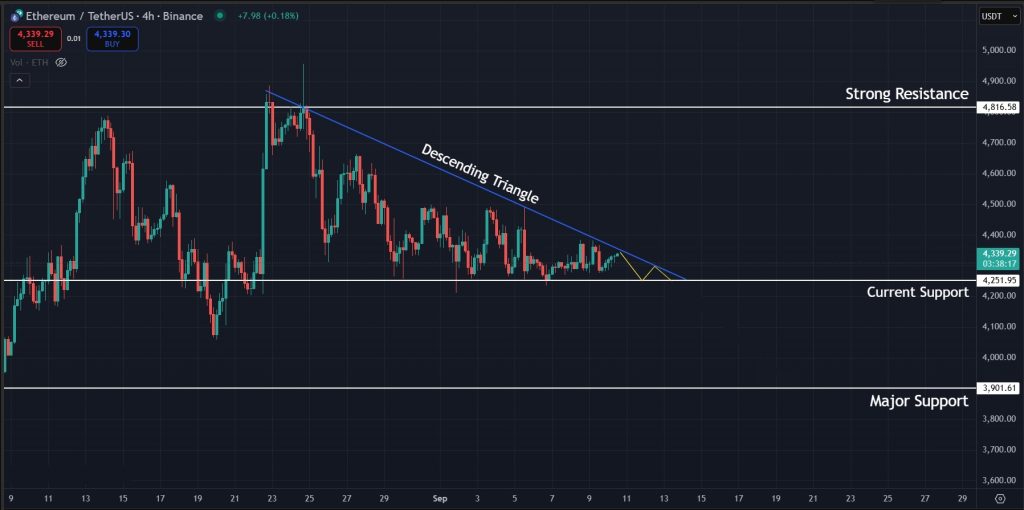
Switching to the 4-hour charts, we can see a descending triangle forming, which is statistically a bearish pattern. The price continues to be squeezed toward the $4,250 mark, and with each bounce from this level, sellers gain more control. If this structure plays out in the short term, our Ethereum price prediction leans bearish, with a breakdown target near $3,900, a major support region.
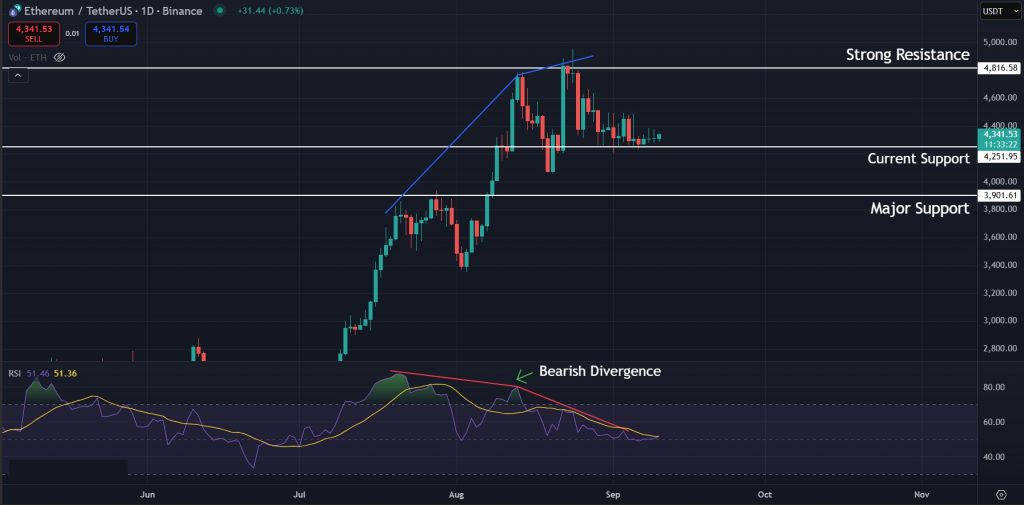
We are also seeing a strong bearish divergence on the 1-day timeframe, indicating that ETH is heading toward a correction. No indicators have invalidated this bearish divergence yet, so the price is still expected to move toward a correction in the coming weeks.
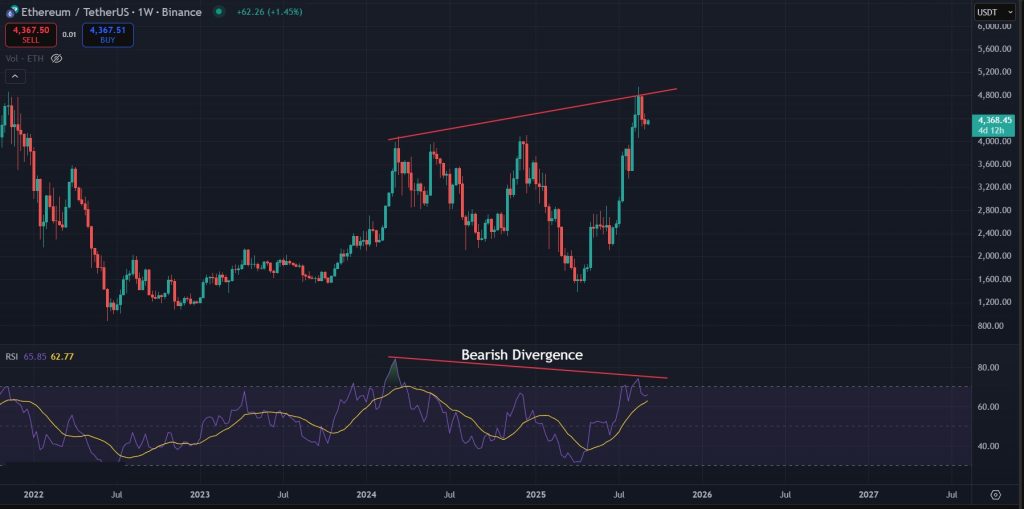
Furthermore, there is another bearish divergence on the 1-week timeframe, adding more evidence that Ethereum is currently in the overbought range. This bearish divergence has been active for a while and has not yet been invalidated by price action.
Final Takeaway: What is Next for Ethereum (ETH)?
Ethereum is currently trading around the $4,300 mark and continues to be squeezed on the lower timeframes. Although a short-term breakout is possible here due to the ongoing squeeze, the broader structure still points more toward a correction and a likely retest of the region below $4,000. In addition, Ethereum is also showing a couple of bearish divergences across multiple timeframes, which further strengthens the case for a potential correction in the coming weeks.
Join WEEX and unlock 40 USDT back with your first deposit-and-trade step. Deposit 100 USDT and start trading.
Disclaimer: All content on The Moon Show is for informational and educational purposes only. The opinions expressed do not constitute financial advice or recommendations to buy, sell, or trade cryptocurrencies. Trading involves significant risk and may result in substantial losses. Always seek independent financial advice before making investment decisions. The Moon Show is not responsible for any financial losses or decisions made based on the information provided.
Please view the full disclaimer at: https://themoonshow.com/disclaimer

HYPE Drops Toward $60 As Chip Selloff Hits Crypto
HYPE dropped toward $60 on July 17 as a chip-led selloff pulled risk assets lower. The token fe...

ONDO Surges as DTCC Tokenized Stock Push Brings Wall Street Rails Onchain
ONDO became one of the market’s stronger movers after Ondo launched tokenized stock representat...

Chainlink Tests $8.40 As Mantle’s CCIP Move Puts LINK Back In Focus
Chainlink is getting fresh attention after Mantle moved its $2.5B+ Super Portal from LayerZero ...