 Price Prediction: Bullish Divergence Offers Bounce, But Macro Trend Still Against Buyers")
Bitcoin (BTC) Price Prediction: Bullish Divergence Offers Bounce, But Macro Trend Still Against Buyers
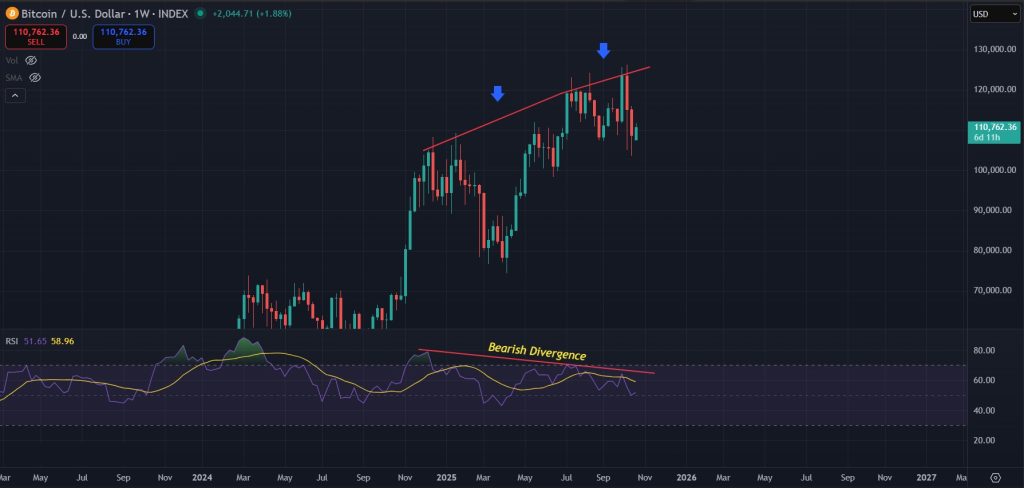
Bitcoin is currently hovering around the $110,000 mark and is showing strength on the lower timeframes. As mentioned in previous analysis, BTC is still in a critical zone that could lead to further downside in the coming weeks. The market has remained overbought for the past couple of months and the 1-week chart continues to signal a large bearish divergence. Despite that, the recent price action is offering some short-term relief and buyers have managed to build reasonable momentum. For this move to develop into something meaningful, bulls must reclaim key levels and turn them into support. With that in mind, let us take a look at the latest Bitcoin charts and see where the price could be headed next.
Our Bitcoin Price Prediction Summary
- Bitcoin is bouncing on lower timeframes with a clear bullish divergence, but momentum still hinges on reclaiming $112,000 as support.
- The weekly bearish divergence remains intact, signaling risk of a deeper correction if bulls lose steam.
- Short-term relief is in play, but the broader bias stays cautiously bearish until key resistance levels flip.
Join WEEX and verify your account to claim a 10–100 USDT coupon. Fund your account to access deposit bonuses and ongoing trading rewards.
Analyzing the Charts
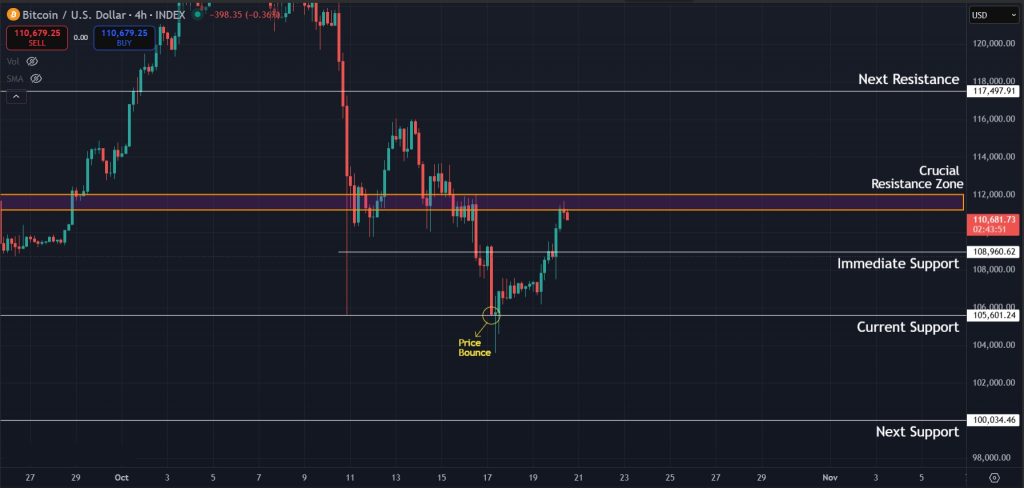
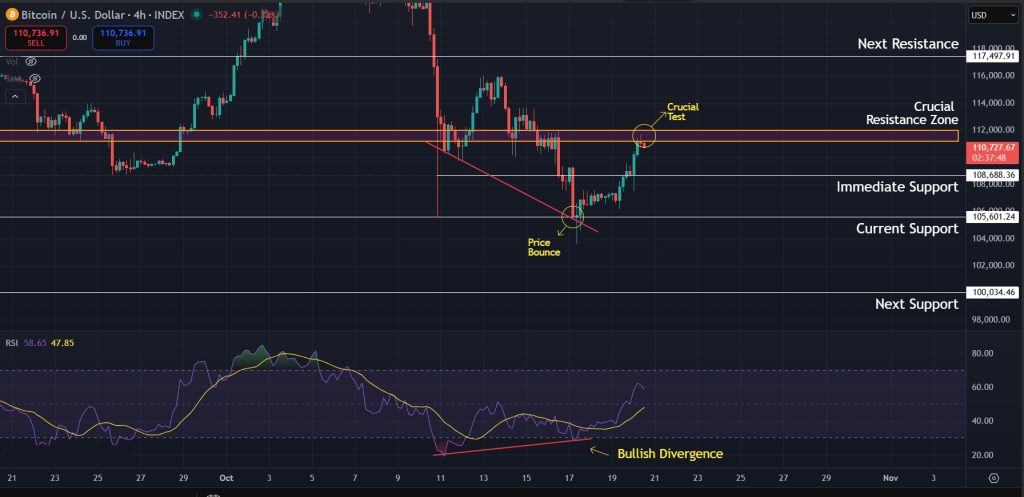
4H Chart Retests $111K–$112K Resistance Zone
Looking at the 4-hour chart, Bitcoin is currently retesting the resistance zone between $111,000 and $112,000 and is attempting to break above it. The price recently gained strong momentum after bouncing from the $115,500 area, which led to a clean breakout. Buyers are putting in solid effort, but they must flip this resistance zone into support for the move to continue upward in a sustainable manner.
Bullish Divergence Offers Relief
The RSI on the 4-hour chart is also showing bullish signs, with a clear bullish divergence taking shape. A setup like this often leads to either a breakout or a short consolidation phase. A similar pattern appeared last month on the same timeframe, and resulted in a breakout that pushed Bitcoin to new all-time highs. This time, however, buyers will need much stronger conviction to repeat that move, as bears still hold control over the broader trend. Until the price breaks above the $112,000 region with momentum, the Bitcoin price prediction for the coming weeks remains tilted to the bearish side.
Macro Bearish Divergence Still Unresolved
Shifting to the 1-week timeframe, the bearish divergence we have been tracking is still intact. This larger trend suggests that a deeper correction is likely and continues to act as a major obstacle for the price. If buyers start losing momentum again in the short term and Bitcoin falls below $105,500, a retest of $100,000 becomes highly probable. A breakdown from that level could open the door to even lower targets.
Final Takeaway: What is Next for Bitcoin?
In conclusion, Bitcoin is showing signs of short term strength, but the broader trend has not shifted yet. Lower timeframes are providing some relief, supported by bullish divergence on the RSI. If buyers manage to reclaim and hold the $112,000 region as support, the current bounce could extend further. However, failure to break above that level with conviction would likely hand control back to the bears. The weekly bearish divergence remains a major concern and continues to hint at a larger correction ahead. Until key resistance levels are flipped on higher timeframes, the bias for the coming weeks stays slightly bearish with caution advised on long positions.
Join WEEX and verify your account to claim a 10–100 USDT coupon. Fund your account to access deposit bonuses and ongoing trading rewards.
Disclaimer: All content on The Moon Show is for informational and educational purposes only. The opinions expressed do not constitute financial advice or recommendations to buy, sell, or trade cryptocurrencies. Trading involves significant risk and may result in substantial losses. Always seek independent financial advice before making investment decisions. The Moon Show is not responsible for any financial losses or decisions made based on the information provided.
Please view the full disclaimer at: https://themoonshow.com/disclaimer

Bitcoin Drops Toward $62K As Chip Selloff And Strategy Warning Pressure BTC
Bitcoin came under pressure again on June 24 as the wider selloff in chip and AI-linked stocks ...

XRP Slides Toward $1.10 As Buyers Face Another Support Test
XRP is back near a level buyers have defended several times this month. The token traded close ...

Bitcoin Holds Near $65K as Bear-Flag Warning Keeps $60K In Focus
Bitcoin held near $65K as traders weighed a bearish chart warning, cautious derivatives positio...