 Price Prediction: Bears Push Toward $100K as Breakdown Deepens")
Bitcoin (BTC) Price Prediction: Bears Push Toward $100K as Breakdown Deepens
Bitcoin is currently trading just below the $105,000 mark and continues to show bearish signs on the daily timeframe. As mentioned in our previous analysis, BTC did manage to recover from last week’s flash crash with some momentum, but that bounce was short-lived and the price began losing strength again. The downtrend has now been confirmed, as expected, and the price appears to be heading back toward lower levels. At this stage, Bitcoin seems to be preparing for a deeper correction as sellers remain in control of the market. Let’s take a closer look at the latest BTC charts to determine where the price could be headed in the coming weeks.
Our Bitcoin Price Prediction Key Takeaways
- Bitcoin continues to lose momentum, confirming a broader downtrend across both daily and weekly charts.
- The $100,000 support is now the key level to watch, with a breakdown potentially sending price even lower.
- Bulls haven't shown any real strength yet, so sentiment remains bearish unless momentum flips.
Join WEEX and verify your account to claim a 10–100 USDT coupon. Fund your account to access deposit bonuses and ongoing trading rewards.
Analyzing the Bitcoin Charts
Price struggling at $105,500 support
Looking at the latest 1-day chart for Bitcoin, the price is currently hovering around the $105,500 support level and is clearly struggling to hold above it. The price appears to be slipping below this zone, and if a daily candle closes beneath it, that would confirm a breakdown of the support and signal further downside. Such a move could trigger another sell-off, bringing the lower levels we have been watching back into focus.
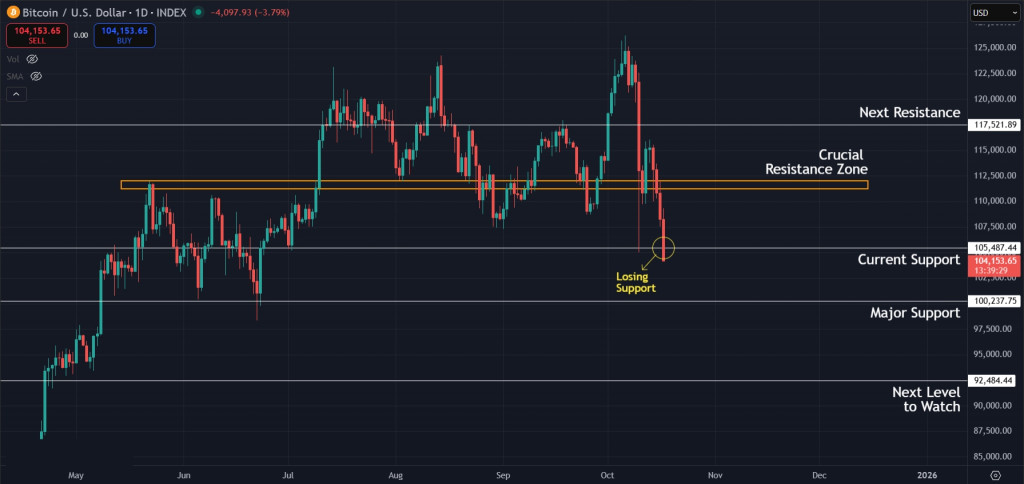
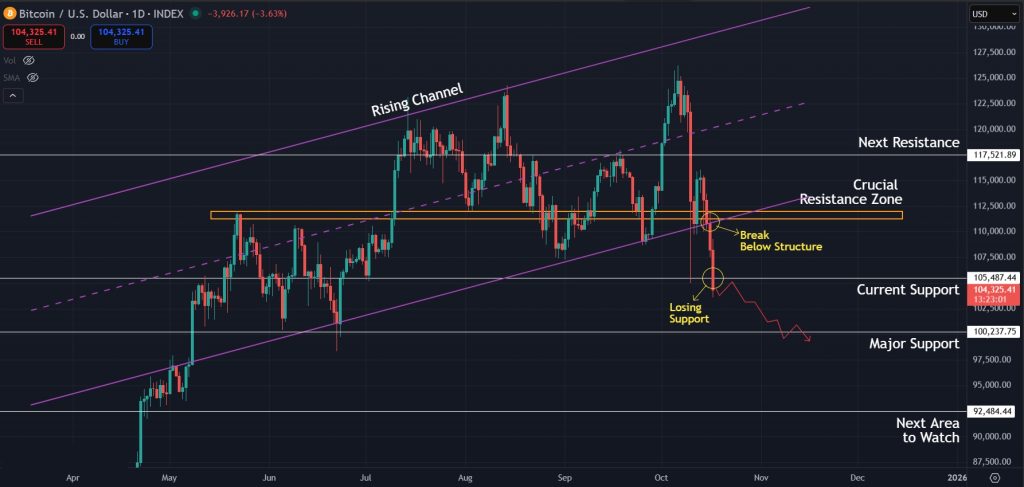
Rising Channel Breakdown Confirms Weakness
Another key observation is that Bitcoin has also broken below the Rising Channel pattern on the 1-day timeframe, which we highlighted earlier. This trendline support was lost around the same time the price fell below the horizontal support area between the $111,000 and $112,000 range. The breakdown of this structure further strengthens the bearish outlook, increasing the likelihood of continued downside. The main support level to watch now is the $100,000 zone. Buyers will likely attempt to defend this area, as it has acted as support before and also carries psychological importance. However, current market direction suggests that even more downside is possible. If $100,000 fails to hold, a move toward the $92,000 region becomes highly probable.
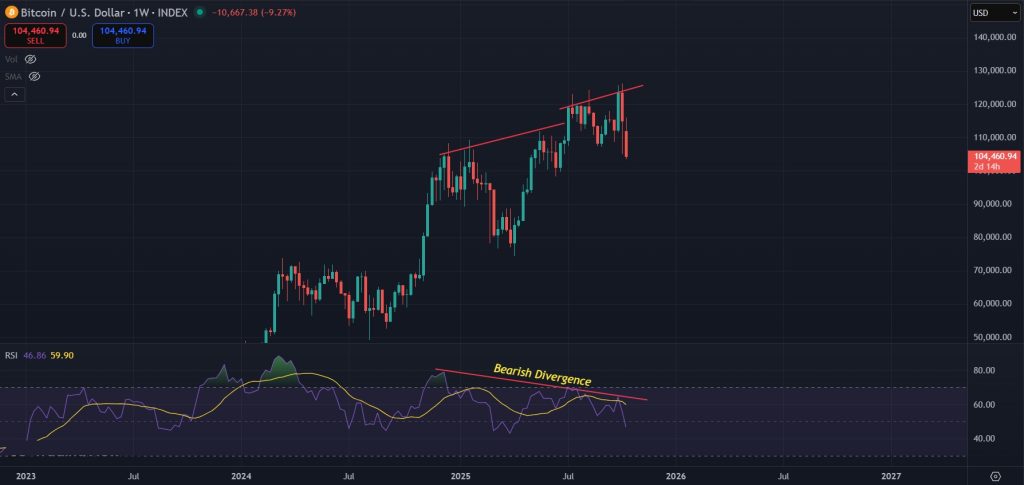
Macro Timeframe Indicators Align Bearish
Now looking at the 1-week timeframe, there is another bearish signal that has been on our radar for a while. A clear Bearish divergence has been developing on the weekly chart, and we have pointed it out in earlier analyses as a key risk factor. This setup was visible even before the flash crash that took place last Friday, and it has been hinting at a larger correction. That move is now unfolding, which is why our recent Bitcoin price prediction has remained bearish.
Final Takeaway: What is Next for Bitcoin (BTC)?
In summary, Bitcoin remains under pressure across both the daily and weekly timeframes. The break below key support levels on the 1-day chart, combined with the confirmed bearish divergence on the weekly chart, signals that sellers are still in control. The $100,000 zone is now the most important support to watch. A bounce from this level could provide some short-term relief, but there is no clear sign of a trend reversal yet. If $100,000 fails, a deeper move toward the $92,000 region becomes likely. Until the indicators start showing renewed strength from the bulls, the overall outlook for our Bitcoin price prediction remains bearish in the near term.
Join WEEX today and walk away with a deposit bonus, a coupon worth up to 100 USDT, and trading rewards that grow as you trade more.
Disclaimer: All content on The Moon Show is for informational and educational purposes only. The opinions expressed do not constitute financial advice or recommendations to buy, sell, or trade cryptocurrencies. Trading involves significant risk and may result in substantial losses. Always seek independent financial advice before making investment decisions. The Moon Show is not responsible for any financial losses or decisions made based on the information provided.
Please view the full disclaimer at: https://themoonshow.com/disclaimer

Bitcoin Drops Toward $62K As Chip Selloff And Strategy Warning Pressure BTC
Bitcoin came under pressure again on June 24 as the wider selloff in chip and AI-linked stocks ...

XRP Slides Toward $1.10 As Buyers Face Another Support Test
XRP is back near a level buyers have defended several times this month. The token traded close ...

Bitcoin Holds Near $65K as Bear-Flag Warning Keeps $60K In Focus
Bitcoin held near $65K as traders weighed a bearish chart warning, cautious derivatives positio...