 Price Analysis (Aug 01, 2025): Consolidation Break Signals Potential Liquidity Grab")
Bitcoin (BTC) Price Analysis (Aug 01, 2025): Consolidation Break Signals Potential Liquidity Grab
Bitcoin is trading just below $115,000 and continues to show weakness in the short term. The recent decline began after US President Donald Trump issued an executive order introducing trade tariffs on several countries, triggering a negative reaction across global markets. This move pushed Bitcoin below the $115,500 support zone, which now appears to be acting as resistance on the lower timeframes. The breakdown signals a possible continuation of the correction unless buyers step in soon and reclaim that level. Let’s take a closer look at the charts to see where Bitcoin might be headed next.
Analyzing the Charts
Looking at the 4-hour chart, the first clear signal is the breakdown below the consolidation range that Bitcoin held for the past 20 days. This range had provided support and kept price action relatively stable, but the recent move has pushed BTC out of that zone. Price now appears to be trending lower, with momentum shifting in favor of the bears.
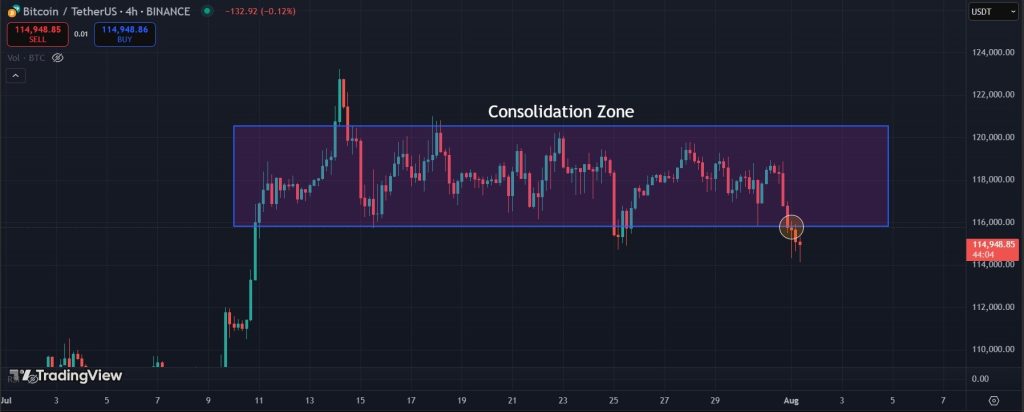
The previous sideways movement largely reflected capital rotating into altcoins, while Bitcoin managed to hold steady above the $115,500 support. Now that this level has been broken, it’s likely to flip into resistance. This shift opens the door for a potential retest of lower levels as Bitcoin searches for liquidity. The key zone to watch in that case sits just above $111,000, an area where strong buying volume was previously observed.
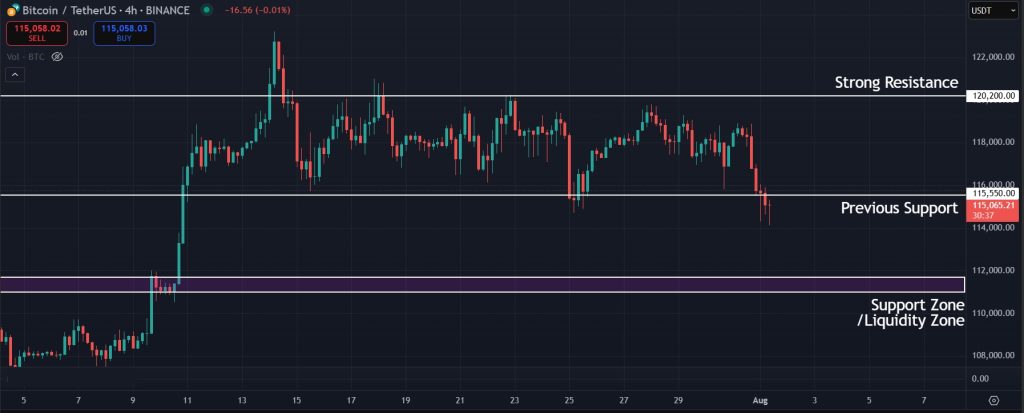
Zooming out to the daily timeframe, Bitcoin has broken below a symmetrical triangle that had been forming over the past few weeks. The pattern has now confirmed its breakdown, and price is moving in line with that structure. The zone just above $111,000 remains a critical area to watch. This region also aligns with the neckline of the inverse head and shoulders pattern that Bitcoin previously broke out from, which could now serve as support. A brief wick into the lower support zone is possible as part of a liquidity grab, and that move could shape the next Bitcoin price prediction if bulls reclaim control.

Final Takeaway: What is Next for Bitcoin (BTC)?
Bitcoin is currently trading below $115,000 after breaking down from its recent consolidation range. The price has lost short-term support and is now moving lower, with the $111,000 zone looking like the next key area to watch. A bounce from this zone is possible, especially since it aligns with the neckline of a previous bullish pattern on the macro charts. If buyers defend this area well, Bitcoin could regain momentum and push higher again.
Your $30,000 bonus + 10% discount are waiting on Bybit! Sign up and claim these rewards before they're gone. Time's ticking!
Disclaimer: All content on The Moon Show is for informational and educational purposes only. The opinions expressed do not constitute financial advice or recommendations to buy, sell, or trade cryptocurrencies. Trading involves significant risk and may result in substantial losses. Always seek independent financial advice before making investment decisions. The Moon Show is not responsible for any financial losses or decisions made based on the information provided.
Please view the full disclaimer at: https://themoonshow.com/disclaimer

HYPE Drops Toward $60 As Chip Selloff Hits Crypto
HYPE dropped toward $60 on July 17 as a chip-led selloff pulled risk assets lower. The token fe...

ONDO Surges as DTCC Tokenized Stock Push Brings Wall Street Rails Onchain
ONDO became one of the market’s stronger movers after Ondo launched tokenized stock representat...

Chainlink Tests $8.40 As Mantle’s CCIP Move Puts LINK Back In Focus
Chainlink is getting fresh attention after Mantle moved its $2.5B+ Super Portal from LayerZero ...