 Price Analysis (Jul 16, 2025): Short-Term Levels in Focus as Bulls Hold Momentum")
Bitcoin (BTC) Price Analysis (Jul 16, 2025): Short-Term Levels in Focus as Bulls Hold Momentum
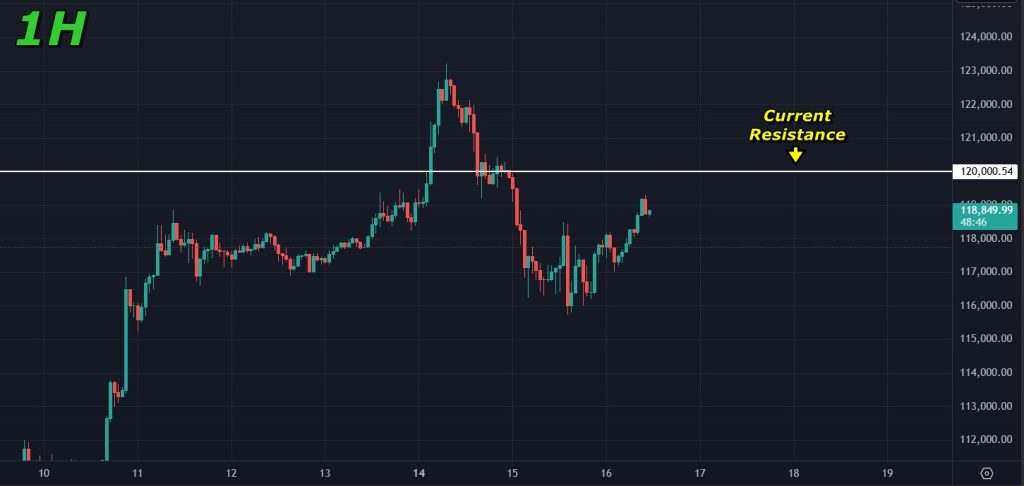
Bitcoin is trading just above $118,500 and continues to show strong bullish momentum. After a clean breakout last week, price briefly pushed above $120,000 before pulling back slightly on the lower timeframes. Yesterday's dip below $116,000 didn’t break the trend and looks more like a short-term retest. The overall outlook remains bullish, with higher targets still on the table. Let’s dive into the charts and map out the key levels for the short term.
Your $30,000 bonus + 10% discount are waiting on Bybit! Sign up and claim these rewards before they're gone. Time's ticking!
Analyzing the Charts
The latest 1-hour chart shows Bitcoin hovering around the $118,500 mark and still holding a bullish structure. The key resistance level to watch now is $120,000. If price manages to break above this level, we could see a continuation toward $130,000 and eventually our target of $140,000. This aligns with our broader Bitcoin price prediction based on current momentum and structure.
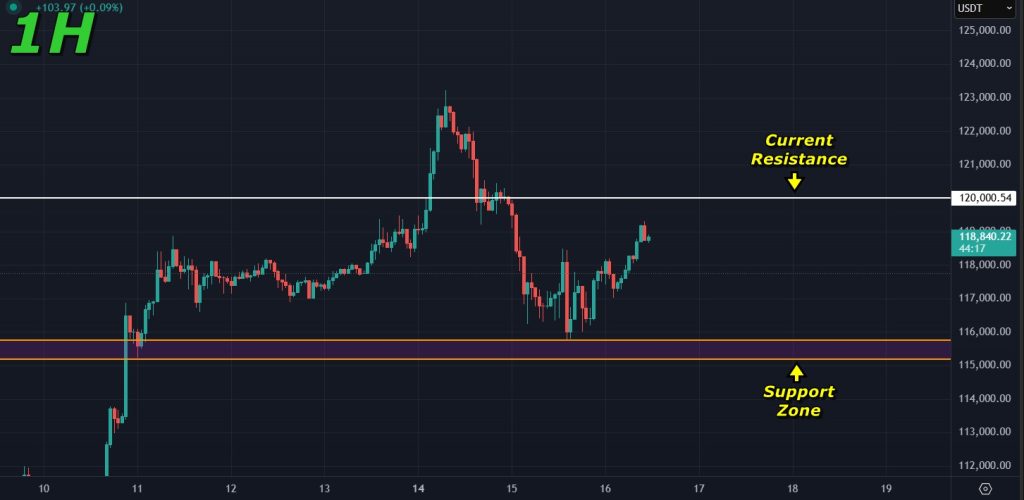
On the other hand, the key support to watch is the zone just below $116,000. Price has already retested this area and bounced, showing buyers are still active there. If Bitcoin gets rejected again at $120,000, there’s a good chance this support zone will be tested once more and should hold as the first line of defense before any further correction.
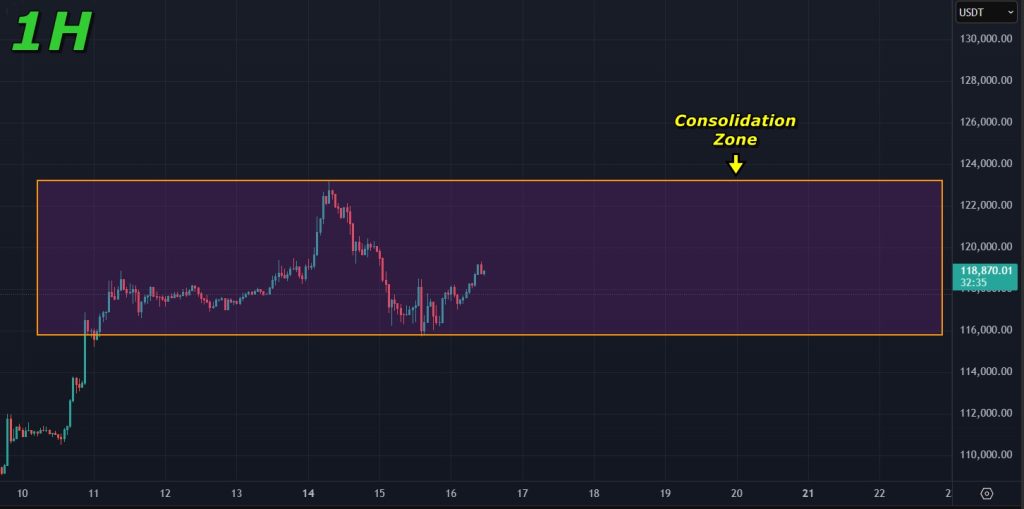
With altcoin season starting to pick up, Bitcoin might enter a very brief consolidation phase despite the recent breakout and strong momentum. A short pause here wouldn’t be unusual and could actually help bulls reset and build momentum for the next leg up in the coming days.
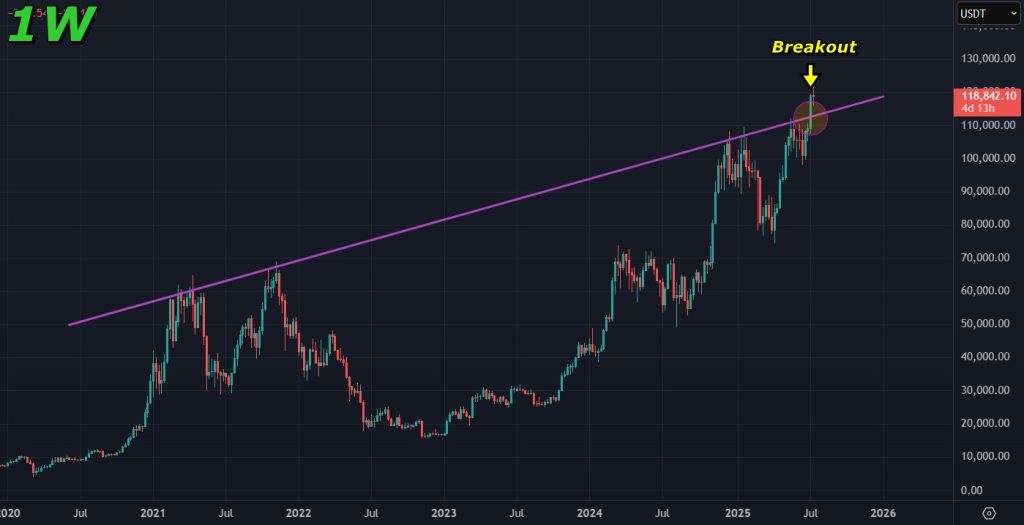
As mentioned in our previous analysis, Bitcoin has confirmed a major breakout on the weekly timeframe. The breakout from the inverse head and shoulders pattern on the 1-week chart signals strong bullish momentum and points toward higher targets. This pattern suggests that a new all-time high could be on the horizon if the trend continues.
Final Takeaway: What is Next for Bitcoin (BTC)?
Bitcoin is trading around the $118,500 level and holding its bullish structure. While a short-term consolidation is possible, especially with altcoin season gaining momentum, the overall trend still favors the bulls. The key level to break is $120,000, and if that happens, we could see a move toward $130,000 and eventually $140,000. Until then, support near $116,000 should continue to hold as buyers stay in control.
Start trading on Bybit today and get 10% off fees PLUS up to $30,000 in bonuses! Sign up today and start saving while you earn. This exclusive offer won't last - claim yours now!
Disclaimer: All content on The Moon Show is for informational and educational purposes only. The opinions expressed do not constitute financial advice or recommendations to buy, sell, or trade cryptocurrencies. Trading involves significant risk and may result in substantial losses. Always seek independent financial advice before making investment decisions. The Moon Show is not responsible for any financial losses or decisions made based on the information provided.
Please view the full disclaimer at: https://themoonshow.com/disclaimer

HYPE Drops Toward $60 As Chip Selloff Hits Crypto
HYPE dropped toward $60 on July 17 as a chip-led selloff pulled risk assets lower. The token fe...

ONDO Surges as DTCC Tokenized Stock Push Brings Wall Street Rails Onchain
ONDO became one of the market’s stronger movers after Ondo launched tokenized stock representat...

Chainlink Tests $8.40 As Mantle’s CCIP Move Puts LINK Back In Focus
Chainlink is getting fresh attention after Mantle moved its $2.5B+ Super Portal from LayerZero ...