 Price Analysis: Hidden Bullish Divergence Points Higher, Key Levels to Watch")
Bitcoin (BTC) Price Analysis: Hidden Bullish Divergence Points Higher, Key Levels to Watch
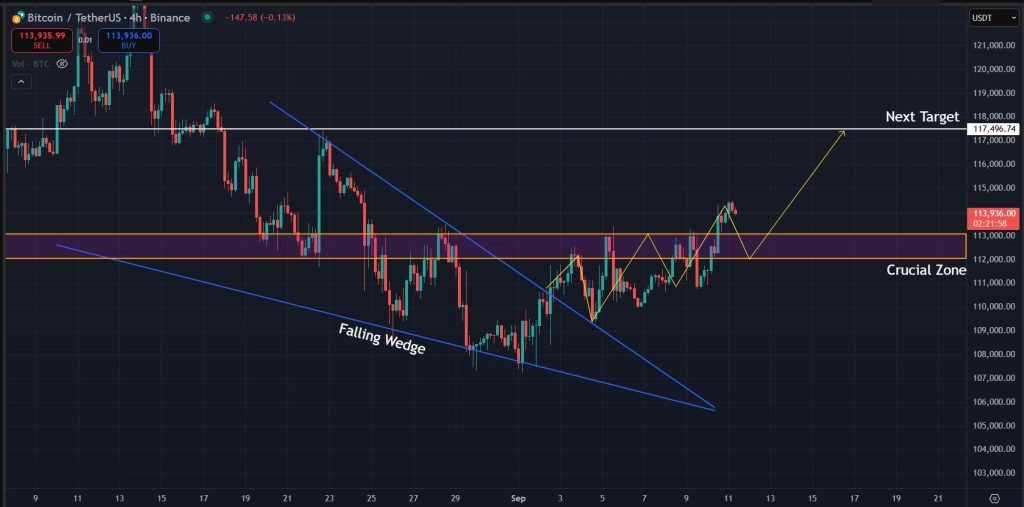
Bitcoin is currently around the $114,000 mark and has started to gain momentum on lower timeframes. The falling wedge pattern we highlighted in our previous analysis played out exactly as we predicted, and BTC is now trading above the $112,000 zone, which is a crucial area that we have been watching for the past month. Right now, things are again looking positive for BTC as the momentum is slowly rising. However, we are still not out of the woods, and a correction for Bitcoin in the coming weeks is still quite likely. Let's take a look at the latest BTC price charts to see where the price could be.
Key Takeaways
- Bitcoin is holding above the $112,000 zone and eyeing $117,500 as the next key target.
- Short-term momentum looks bullish, but resistance at $114,500 remains a crucial hurdle.
- A deeper correction toward $110,000–$108,000 is still possible if BTC fails to break higher.
Get started on WEEX with a simple 40 USDT reward. Deposit 100 USDT, make your trade, and claim the bonus.
Analyzing the Bitcoin Charts
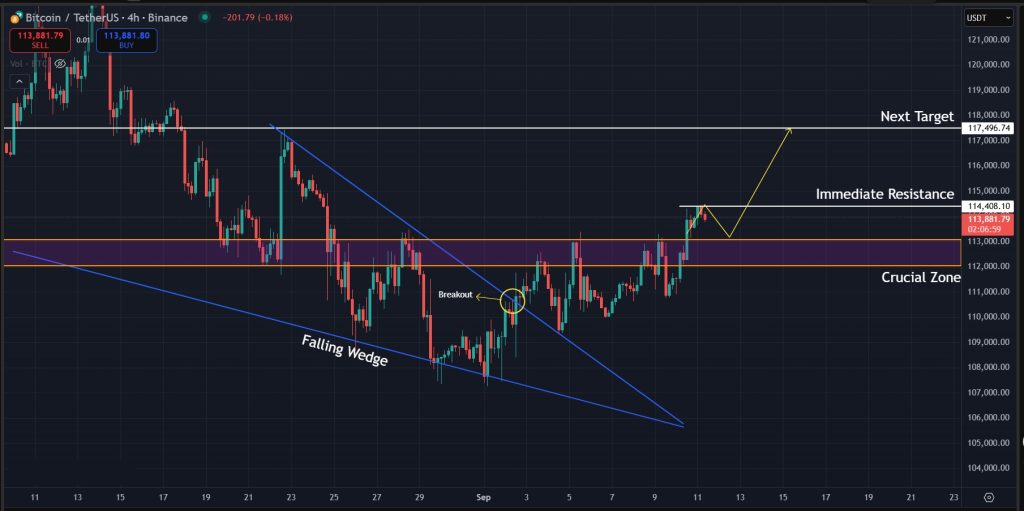
If we take a look at the latest 4-hour charts for Bitcoin, we can see how the price broke out of the falling wedge pattern beautifully, and after rejecting the $112,000 mark post-breakout, it retested the top of the wedge and bounced nicely with momentum. Right now, the price is trading above the $112,000–$113,000 zone and is aiming for higher targets. The first level we are watching here for BTC in the short term is the $117,500 mark.
While the breakout hints toward $117,500, we also have immediate resistance at the $114,500 mark, and the price must not fail here in order to keep the uptrend intact. Once the price manages to get above this level in the coming days (or even hours), the probability for BTC to reach $117,500 will become quite high, and our Bitcoin price prediction will start leaning bullish.
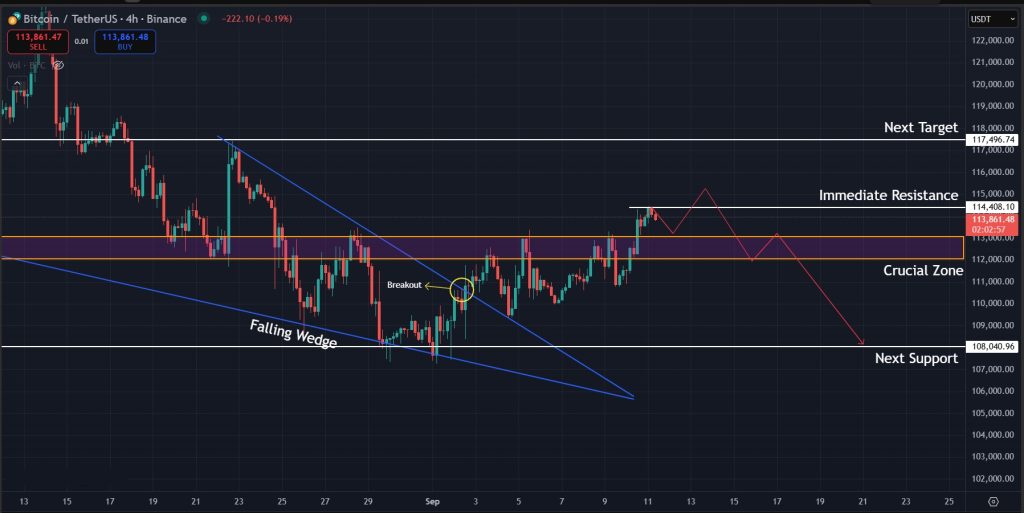
On the other hand, if the price fails to break above $117,500 in the short term, we can expect it to once again move toward a correction. If that happens, the first line of defense is again the $112,000 zone. However, if the price moves even further, we can expect a stronger correction, and the first level we will be eyeing is the $110,000 mark, followed by the $108,000 zone where the price found support previously.
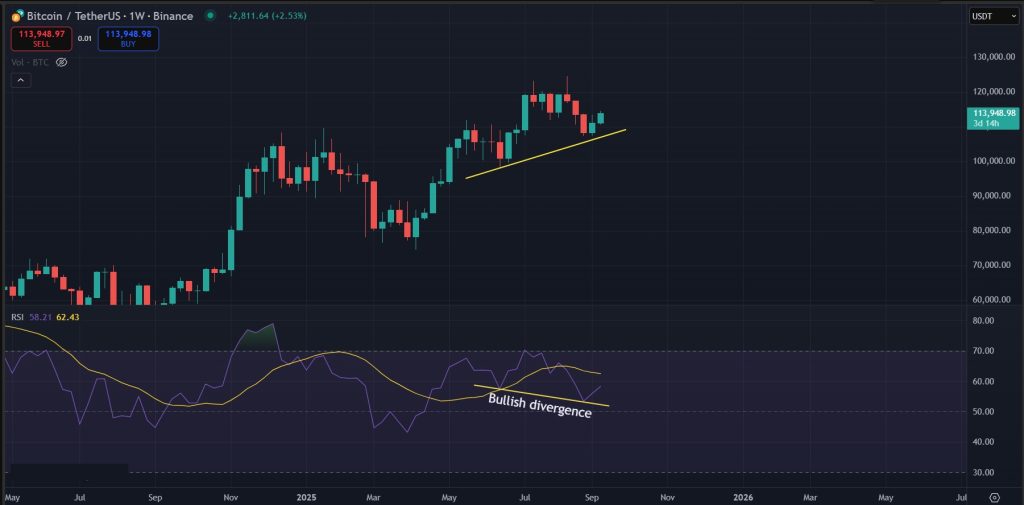
Also, if we zoom out further on the 1-week timeframe, we can see a hidden bullish divergence for Bitcoin that could turn the tables. If this bullish divergence were to play out in the coming weeks, we can expect BTC to continue the uptrend and challenge the $124,000 mark once again.
Final Takeaway: What is Next for Bitcoin (BTC)?
Bitcoin is currently trading just below the $114,500 mark and is gaining momentum on lower timeframes. The target we have in sight right now is the $117,500 mark. With the price leaning slightly bullish and a hidden bullish divergence on the weekly timeframe, it is possible we will see an uptrend for BTC on lower timeframes. However, BTC is not out of the woods yet, and a deeper correction below $110,000 remains a strong possibility.
Join WEEX and unlock 40 USDT back with your first deposit-and-trade step. Deposit 100 USDT and start trading.
Disclaimer: All content on The Moon Show is for informational and educational purposes only. The opinions expressed do not constitute financial advice or recommendations to buy, sell, or trade cryptocurrencies. Trading involves significant risk and may result in substantial losses. Always seek independent financial advice before making investment decisions. The Moon Show is not responsible for any financial losses or decisions made based on the information provided.
Please view the full disclaimer at: https://themoonshow.com/disclaimer

HYPE Drops Toward $60 As Chip Selloff Hits Crypto
HYPE dropped toward $60 on July 17 as a chip-led selloff pulled risk assets lower. The token fe...

ONDO Surges as DTCC Tokenized Stock Push Brings Wall Street Rails Onchain
ONDO became one of the market’s stronger movers after Ondo launched tokenized stock representat...

Chainlink Tests $8.40 As Mantle’s CCIP Move Puts LINK Back In Focus
Chainlink is getting fresh attention after Mantle moved its $2.5B+ Super Portal from LayerZero ...