 Price Analysis (Jul 08, 2025): Key Levels to Watch Short-Term")
Bitcoin (BTC) Price Analysis (Jul 08, 2025): Key Levels to Watch Short-Term
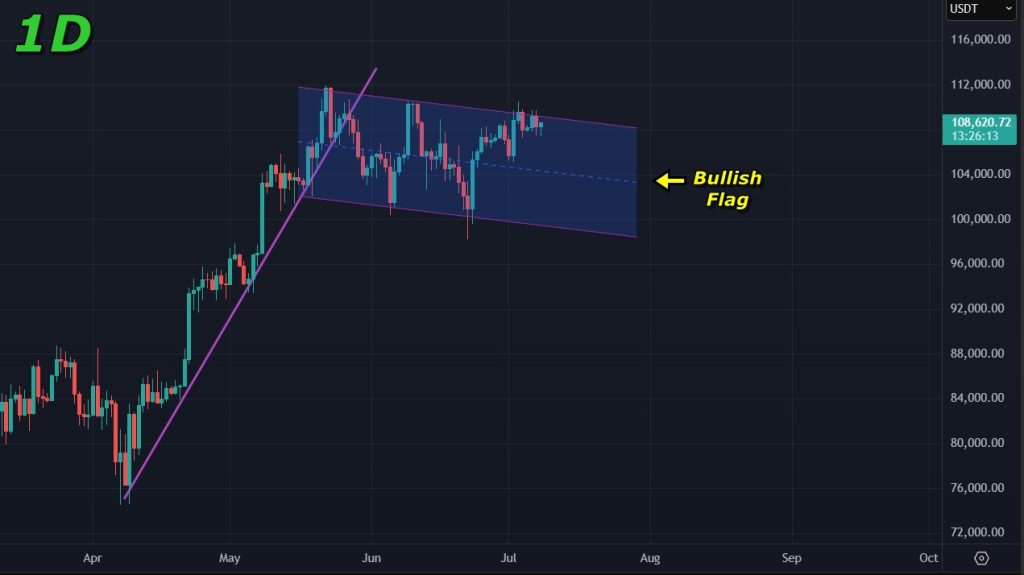
Bitcoin (BTC) is hovering around $108,500, still stuck in a sideways grind on the lower timeframes. As we noted in our last report, BTC is consolidating with little momentum to speak of. This kind of sluggish action isn't unusual for summer months, and we could see this chop turn into a correction before any significant moves take shape in the coming weeks. The daily chart shows a bullish flag we’re tracking closely, keeping the longer-term outlook for Bitcoin positive. Let’s dive into the charts to pinpoint the key levels to watch in the near term.
Your $30,000 bonus + 10% discount are waiting on Bybit! Sign up and claim these rewards before they're gone. Time's ticking!
Analyzing the Charts
On the 1-hour chart, Bitcoin is trapped in a tight consolidation zone, going back and forth between resistance at $110,000 and support at $107,500. Volume is noticeably thin, which aligns with the lackluster price action we're seeing right now.
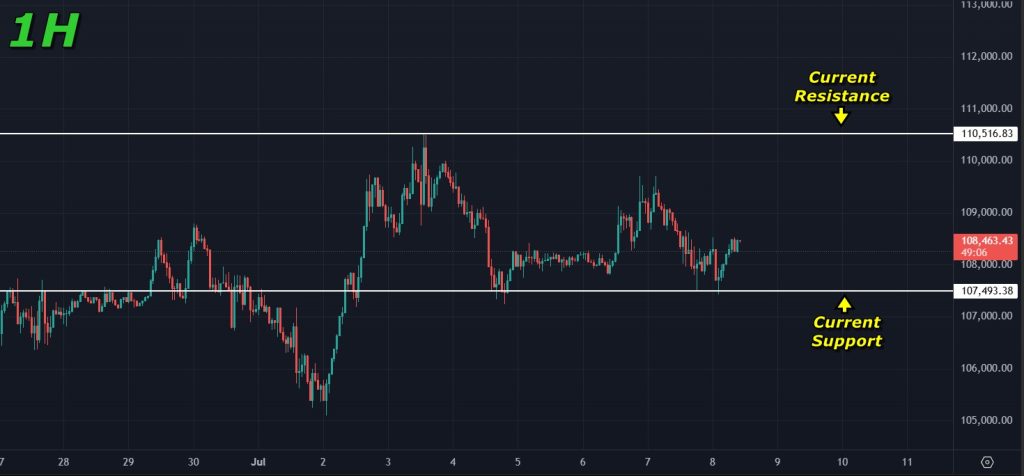
We're also seeing lower highs forming, signaling fading momentum. This setup makes a break below $107,500 increasingly likely, which could send Bitcoin to retest lower levels. If that correction kicks in, the $104,000 zone is our first target to watch, given its history as a solid support area.
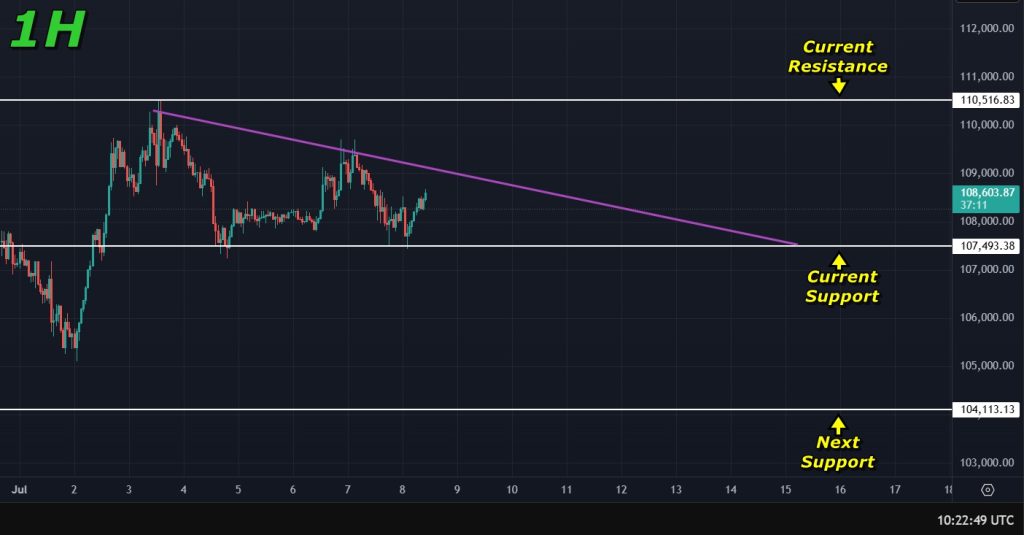
The lower timeframes show Bitcoin stuck in neutral, with price action flatlining for about a week now. This sluggish trend could drag on a bit longer, but a correction looks likely soon, potentially pulling BTC below the $100,000 mark.
Important Reads: How to Buy Bitcoin?
On the daily chart, the bullish flag remains intact, with price still trading inside its pattern. This setup supports the possibility of a dip below $100,000 before Bitcoin gears up for its next rally.
Final Takeaway: What is Next for Bitcoin (BTC)?
Bitcoin is trading near $108,500, stuck in a consolidation phase on the lower timeframes with low momentum. We could see this sideways action persist, likely followed by a correction that tests support around $104,000 or even below $100,000. However, the bullish flag on the daily chart keeps the longer-term outlook positive, suggesting a potential rally once the correction plays out. Keep an eye on $107,500 for a break lower and $110,000 for any signs of an upside push.
Start trading on Bybit today and get 10% off fees PLUS up to $30,000 in bonuses! Sign up today and start saving while you earn. This exclusive offer won't last - claim yours now!
Disclaimer: All content on The Moon Show is for informational and educational purposes only. The opinions expressed do not constitute financial advice or recommendations to buy, sell, or trade cryptocurrencies. Trading involves significant risk and may result in substantial losses. Always seek independent financial advice before making investment decisions. The Moon Show is not responsible for any financial losses or decisions made based on the information provided.
Please view the full disclaimer at: https://themoonshow.com/disclaimer

HYPE Drops Toward $60 As Chip Selloff Hits Crypto
HYPE dropped toward $60 on July 17 as a chip-led selloff pulled risk assets lower. The token fe...

ONDO Surges as DTCC Tokenized Stock Push Brings Wall Street Rails Onchain
ONDO became one of the market’s stronger movers after Ondo launched tokenized stock representat...

Chainlink Tests $8.40 As Mantle’s CCIP Move Puts LINK Back In Focus
Chainlink is getting fresh attention after Mantle moved its $2.5B+ Super Portal from LayerZero ...