
Bitcoin Drops Toward $62K As Iran Selloff Tests Returning ETF Demand
Bitcoin slipped toward $62,000 on July 8 as renewed U.S.-Iran tensions triggered a wider risk-off move across global markets. Oil prices jumped, stock futures fell and crypto traders moved defensively after President Donald Trump said the ceasefire framework with Iran was “over.” The drop came just as spot Bitcoin ETF inflows were starting to recover, making the setup more mixed than the late-June selloff. ETF demand has improved, but macro pressure is now testing whether buyers can hold BTC above $60,000. Bitcoin needs to reclaim $64,000 to stabilize. If BTC loses $60,000, $58,000 and $56,000 come back into focus.
Key Takeaways
- Bitcoin fell toward $62,000 on July 8 as renewed U.S.-Iran tensions hit risk assets.
- Oil prices jumped after Trump said the Iran ceasefire framework was “over.”
- Spot Bitcoin ETF inflows have started to recover, but the rebound is still fragile.
- Traders are showing more demand for downside protection as BTC pulls back.
- BTC needs to hold $60,000 and reclaim $64,000. A break below $60,000 would put $58,000 and $56,000 back in focus.
Bitcoin Falls as Iran Tensions Hit Risk Assets
Bitcoin came under pressure on July 8 as geopolitical risk returned to the market. BTC fell toward the $62,000 area while altcoins posted sharper losses and stock futures also moved lower.
The selloff followed President Donald Trump’s comments that the ceasefire framework with Iran was “over” after renewed strikes in the region. Reuters reported that oil surged and global markets fell after the remarks, with investors reacting to the risk of another inflation shock from higher energy prices.
Crypto moved with the broader risk-off trade. CoinDesk reported that Bitcoin and Ether fell more than 2% after Trump’s comments, while the CoinDesk 20 Index dropped 2.9% from midnight UTC. Bitcoin was trading near $62,000 during the move.
The pressure was not limited to crypto. Higher oil prices, weaker stock futures and a stronger dollar all made the backdrop harder for Bitcoin. BTC had started July with a better tone after late-June weakness, but the latest macro shock pushed traders back toward defense.
ETF Inflows Are Improving, But Not Enough Yet
Bitcoin’s latest decline is different from the late-June selloff. At the end of June, ETF outflows were one of the main reasons BTC struggled near support. This time, ETF demand has started to recover, but the market is now facing a fresh macro shock.
CoinDesk reported that U.S. spot Bitcoin ETFs pulled in $265.69 million on Monday, the largest daily inflow in more than a month. BlackRock’s IBIT led the move with $209.40 million in inflows.
That helped Bitcoin earlier in the week, but the recovery is not strong enough yet to remove downside risk. The same report noted that spot Bitcoin ETFs still lost a net $526.6 million over the shortened holiday week, showing that the broader flow picture has not fully healed.
Farside data also showed a smaller net inflow on July 7 after the stronger start to the week. That means ETF demand has returned, but not with enough force yet to overpower a major risk-off move.
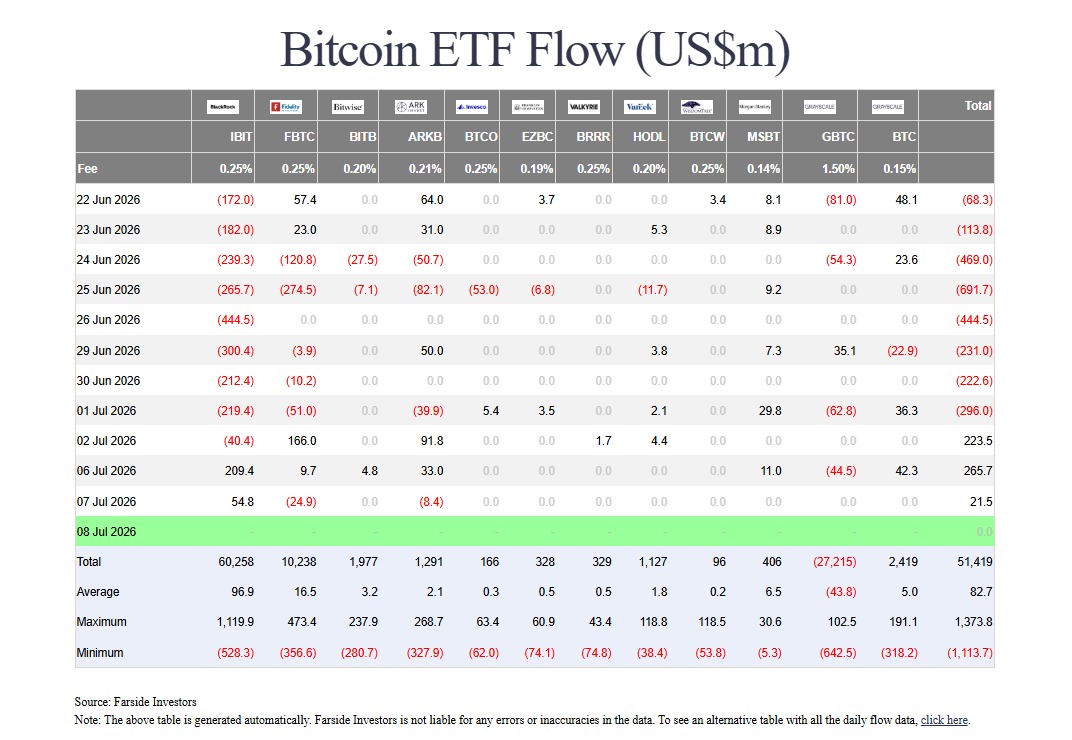
This leaves Bitcoin in a mixed position. ETF flows are no longer clearly bearish, but macro pressure is still controlling the short-term reaction.
Options Traders Turn More Defensive
The derivatives market also shows traders becoming more cautious. CoinDesk noted that BTC futures open interest dropped as price fell, suggesting some leverage came out of the market during the selloff.
The bigger signal came from options. Bitcoin’s one-week options skew on Deribit moved further in favor of puts, showing stronger demand for downside protection. Put options are often used when traders want protection against a deeper drop.
That does not mean the market has turned fully bearish. CoinDesk also noted that some of the highest BTC options activity was still around upside call strikes. Traders are not completely abandoning the bullish case, but they are paying more attention to short-term risk.
For now, that fits the chart. Bitcoin still has ETF support underneath the market, but traders are not comfortable chasing upside while geopolitical risk is rising.
Bitcoin Technical Analysis Shows $60K As The Main Level
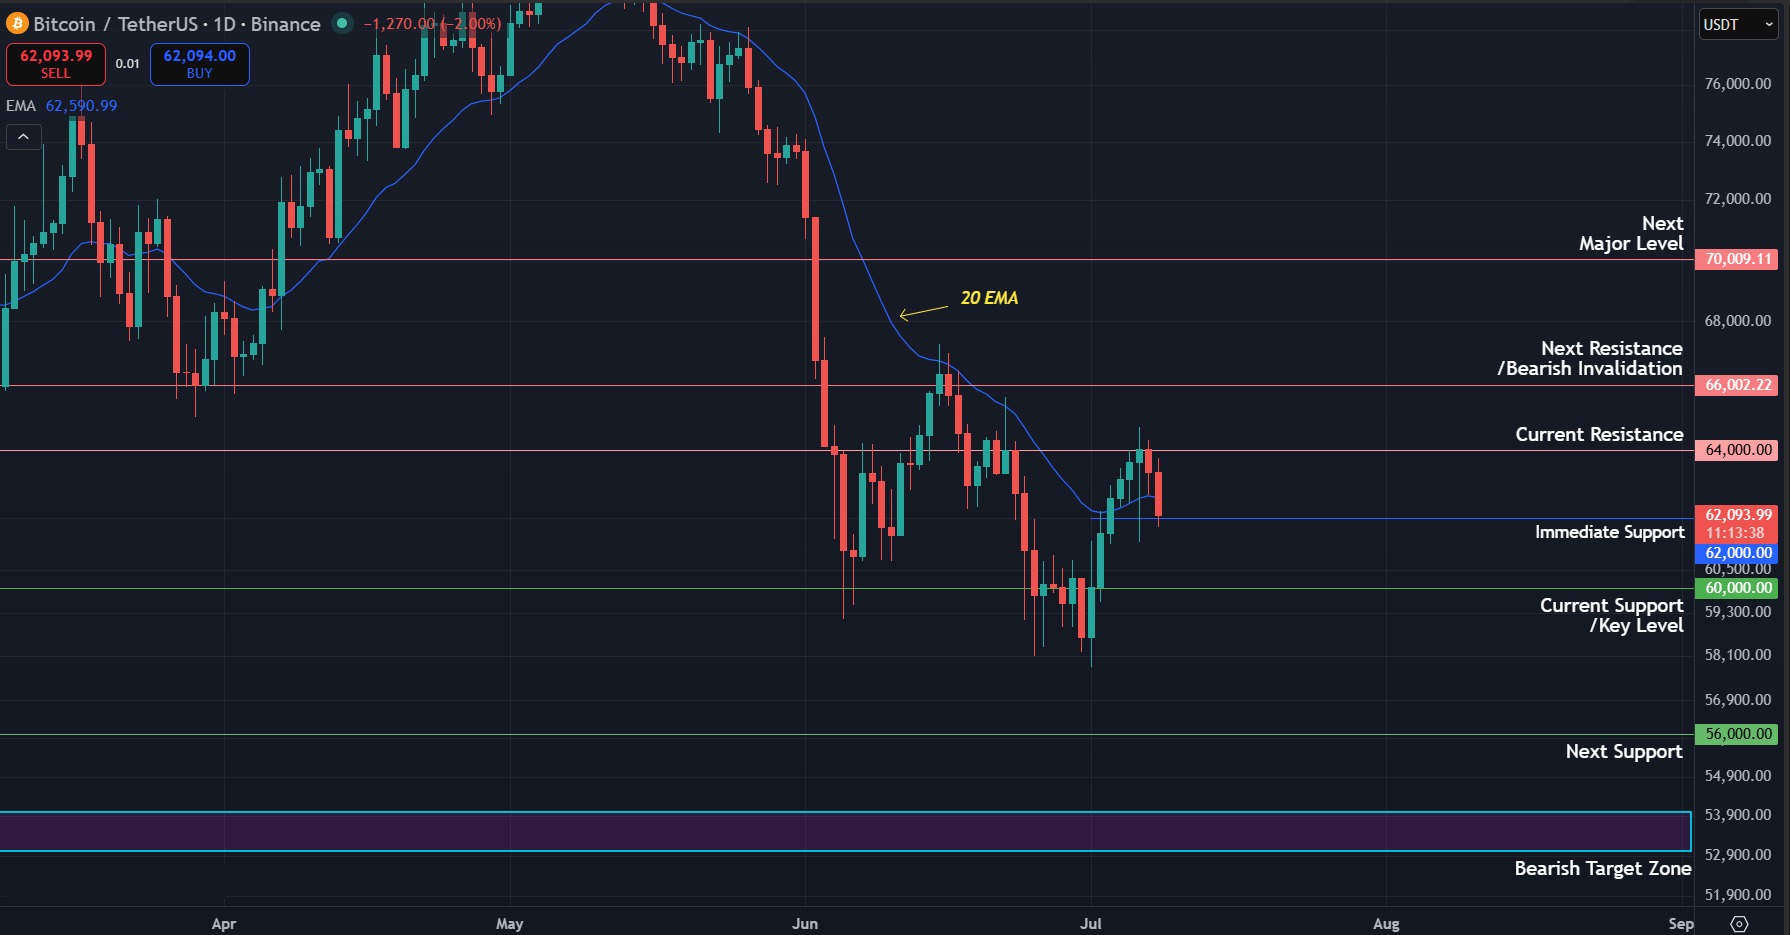
Bitcoin’s daily chart has moved back into a familiar support range. BTC is trading near $62,000 after failing to build a stronger recovery above the mid $60,000 area. The pullback has not fully broken the structure, but it has put pressure back on the lower part of the range.
The key level is $60,000. Bitcoin needs to stay above this level to avoid turning the latest decline into another deeper breakdown. A daily close below $60,000 would show that buyers are losing control again after the recent ETF-led rebound.
Before that, $62,000 is the short-term pressure point. If BTC holds near $62,000 and starts moving higher, buyers can still attempt another recovery. If price keeps closing below $62,000, the chart will likely drift back toward $60,000.
On the upside, $64,000 is the first resistance level. Bitcoin needs to reclaim this level to show that the July recovery is not fading. A move above $64,000 would also reduce pressure from the latest risk-off candle.
The next major level is $66,000. A daily close above $66,000 would give buyers a stronger signal and weaken the bearish setup created by the latest pullback.
If Bitcoin loses $60,000, the first downside level to watch is $58,000. Below that, $56,000 becomes the deeper support level. A move into that area would show that the market has failed to protect the July recovery.
The 20 EMA remains the main momentum guide. If BTC stays below the 20 EMA while trading under $64,000, the recovery remains weak. A daily close above $64,000 and then $66,000 would give buyers a cleaner setup.
For now, Bitcoin is caught between returning ETF demand and renewed macro pressure. The chart is not broken as long as $60,000 holds, but buyers need to recover $64,000 before the latest decline starts to look controlled.
What to Expect Next
- Bullish case: Bitcoin holds above $60,000 and recovers $64,000 on the daily chart. A stronger close above $66,000 would show that buyers have absorbed the latest risk-off move.
- Bearish case: BTC fails to reclaim $64,000 and loses $60,000. That would put $58,000 back in focus, followed by $56,000 if selling continues.
- Key catalyst: The market will watch whether ETF inflows continue and whether the Iran situation keeps oil prices elevated. Strong ETF demand could help BTC stabilize, but another jump in oil or the dollar would keep pressure on risk assets.
- Invalidation: A daily close above $66,000 would weaken the bearish setup. A daily close below $56,000 would confirm a deeper breakdown.
Why is Bitcoin falling today?
Bitcoin is falling because renewed U.S.-Iran tensions triggered a wider risk-off move across global markets. Oil prices jumped, stock futures fell and crypto traders moved defensively as BTC slipped toward $62,000.
Are Bitcoin ETF inflows still positive?
Spot Bitcoin ETF demand has started to improve. U.S. spot Bitcoin ETFs recorded a strong inflow earlier this week, but the broader weekly flow picture is still recovering after several weeks of outflows.
What Bitcoin price level matters now?
The most important level is $60,000. BTC needs to hold this area to avoid a deeper decline. On the upside, $64,000 is the first recovery level, followed by $66,000.
What happens if BTC loses $60,000?
If Bitcoin loses $60,000 on the daily chart, $58,000 becomes the next downside level. A deeper move could bring $56,000 back into focus.
Get started on WEEX with a simple 40 USDT reward. Deposit 100 USDT, make your trade, and claim the bonus.
Disclaimer: All content on The Moon Show is for informational and educational purposes only. The opinions expressed do not constitute financial advice or recommendations to buy, sell, or trade cryptocurrencies. Trading involves significant risk and may result in substantial losses. Always seek independent financial advice before making investment decisions. The Moon Show is not responsible for any financial losses or decisions made based on the information provided.
Please view the full disclaimer at: https://themoonshow.com/disclaimer

Bitcoin and Ethereum Quarterly Returns 2026: Q1-Q3 Trends and Q4 Outlook
Quarterly returns for Bitcoin (BTC) and Ethereum (ETH) offer a simple way to measure how the tw...

LINK Breaks August High as Chainlink Expands Into Global Payments
LINK is holding above $13 on September 7 after gaining 9.9% in the previous session. The move c...

XRP ETF Inflow Streak Ends After $170M Run. Can Price Hold $1.31?
XRP is trading near $1.36 on September 3 after U.S. spot XRP ETFs recorded their first net outf...