 Price Prediction: Descending Triangle Keeps Bears in Control as $2.75 Support Holds")
Ripple (XRP) Price Prediction: Descending Triangle Keeps Bears in Control as $2.75 Support Holds
XRP’s price is holding near $2.90 but still lacks the momentum needed to push higher on the daily chart. As we pointed out in our previous price analysis, XRP did retest the trendline resistance on the 1-day timeframe and rejected it once more. The price has been struggling to break past this trendline since July and as long as this resistance stays intact the risk for further correction for XRP increases every day. Lets take a quick look at the latest XRP charts to see where the price could be headed in coming days and what important levels and region we need to watch in the short term.
Our XRP Price Prediction Summary
- XRP continues to trade within a Descending Triangle, keeping the broader structure bearish.
- The $2.75 support zone is crucial as losing it could trigger a move toward $2.45 or even $2.00.
- A breakout above the trendline resistance is needed to invalidate the bearish setup and shift momentum.
Join WEEX and verify your account to claim a 10–100 USDT coupon. Fund your account to access deposit bonuses and ongoing trading rewards.
Analyzing the XRP Charts
$2.75 Support Remains Crucial for XRP
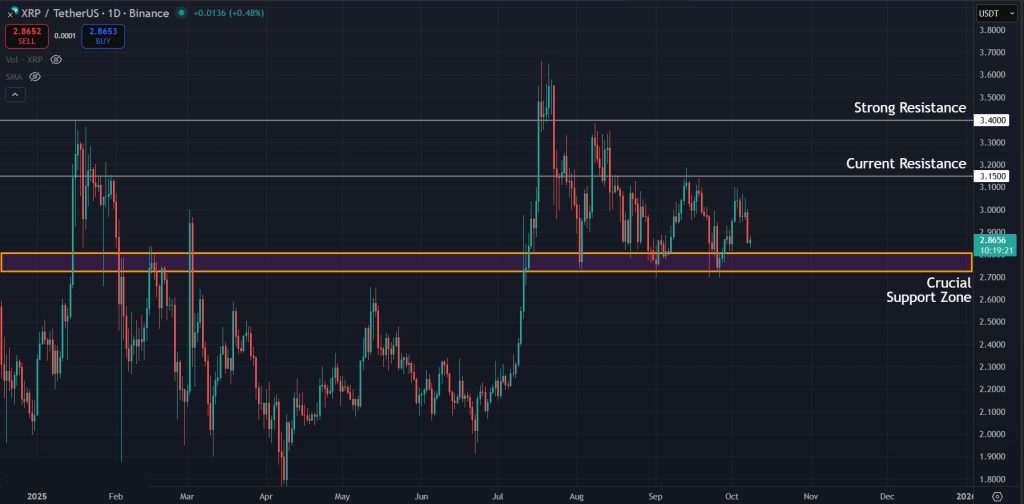
Looking at the latest 1-day chart for XRP, the first key area to note is the support zone between $2.75 and $2.80, which has been holding strong since XRP’s breakout in July. Despite several rejections from the upper levels, buyers have managed to defend this zone consistently. However, each rejection from above weakens this support, and if sellers manage to push the price below it, XRP could see a deeper correction in the coming weeks.
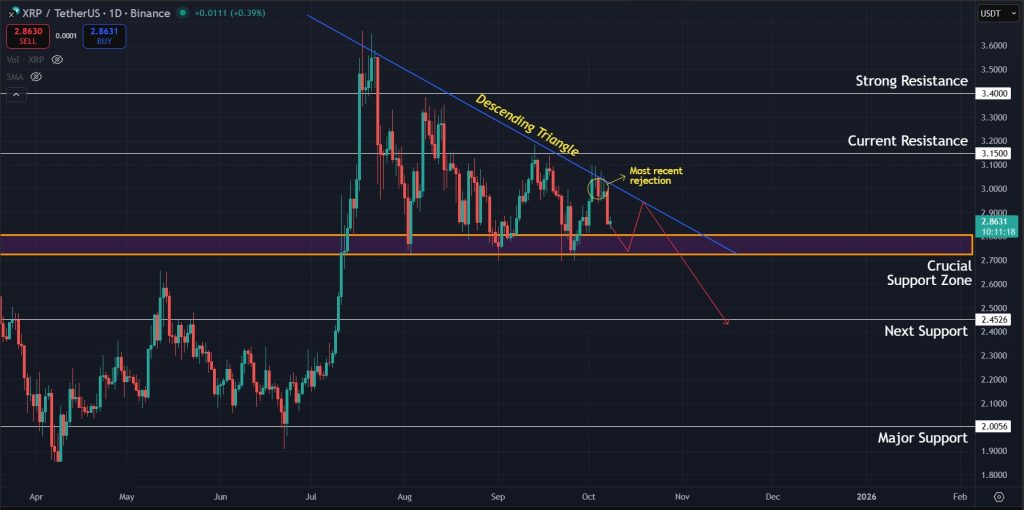
Trendline Rejections Form a Bearish Descending Triangle
The next important point to note is that the repeated rejections are happening right at the trendline that has been pushing the price lower with each retest. This has resulted in a series of lower highs, keeping XRP locked in a downtrend. Recently, the price faced rejection from this level once again and is now moving back toward the $2.75 to $2.80 support zone. It’s also clear that this trendline and support area together are forming a Descending Triangle pattern, which is generally considered a bearish formation. If the price fails to hold this support and drops below it, a sell-off could follow, opening the way for lower levels. In that case, the next key support to watch would be around $2.45, followed by a stronger one near $2.00. This overall structure is also why our latest XRP price prediction remains bearish.
Momentum Indicators Still Favor Sellers
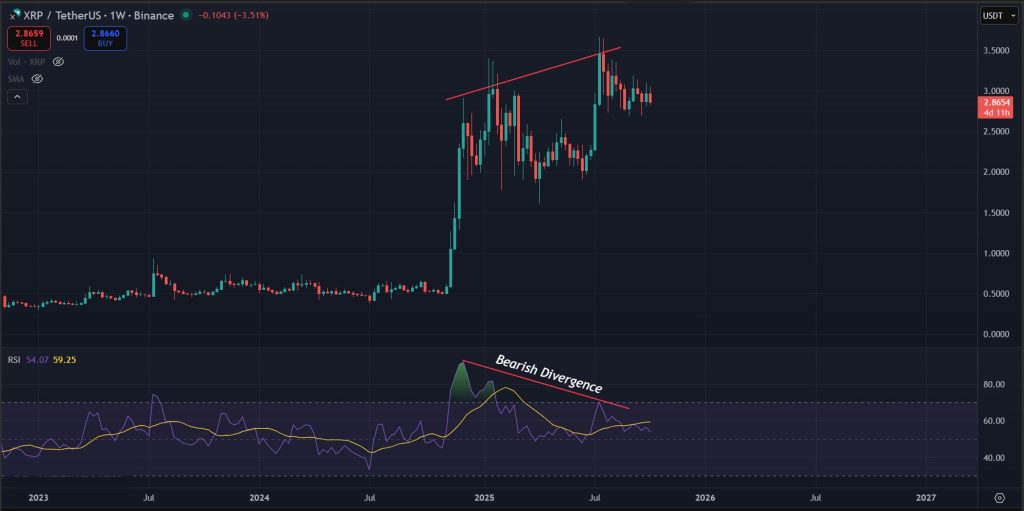
Switching to the 1-week timeframe, the bearish divergence we’ve been tracking remains valid and appears to be playing out at the moment. Unless this structure gets invalidated, both the weekly and daily setups indicate a higher likelihood of continued downside movement. Based on the current outlook, a retest of the $2.00 level for XRP looks increasingly possible in the near future.
Final Takeaway: What is Next for XRP?
XRP remains in a critical phase as the price continues to trade below the key trendline resistance while repeatedly testing the same support zone. The overall structure on both the daily and weekly timeframes still leans bearish, with the Descending Triangle and persistent bearish divergence suggesting that sellers are maintaining control. Unless the price manages to break above the trendline resistance with strong volume confirmation, the risk of another correction remains high. In the short term, holding above $2.75 is crucial for buyers, while a breakdown below this level could trigger a move toward $2.45 or even $2.00. Until momentum shifts decisively, XRP’s outlook will likely stay cautious with more downside potential in play.
Join WEEX today and walk away with a deposit bonus, a coupon worth up to 100 USDT, and trading rewards that grow as you trade more.
Disclaimer: All content on The Moon Show is for informational and educational purposes only. The opinions expressed do not constitute financial advice or recommendations to buy, sell, or trade cryptocurrencies. Trading involves significant risk and may result in substantial losses. Always seek independent financial advice before making investment decisions. The Moon Show is not responsible for any financial losses or decisions made based on the information provided.
Please view the full disclaimer at: https://themoonshow.com/disclaimer

Bitcoin Drops Toward $62K As Chip Selloff And Strategy Warning Pressure BTC
Bitcoin came under pressure again on June 24 as the wider selloff in chip and AI-linked stocks ...

XRP Slides Toward $1.10 As Buyers Face Another Support Test
XRP is back near a level buyers have defended several times this month. The token traded close ...

Bitcoin Holds Near $65K as Bear-Flag Warning Keeps $60K In Focus
Bitcoin held near $65K as traders weighed a bearish chart warning, cautious derivatives positio...