 Price Analysis: Bears Take Over After $0.250 Support Fails")
Dogecoin (DOGE) Price Analysis: Bears Take Over After $0.250 Support Fails
DOGE is currently trading around the $0.225 mark and is still leaning bearish in the immediate short term. In our previous analysis we highlighted the support zone below $0.250 as an important level to watch. That area failed to hold this week after the price faced rejection at $0.270 which led to a notable sell-off. Bears now appear to be taking control of the price and the possibility of a retest of lower levels has increased. To understand the current trend better let’s look at the latest Dogecoin charts and see where the price could be headed in the short term.
Our DOGE Price Prediction Summary
- DOGE failed to hold above $0.250, turning the level into strong resistance.
- The breakdown from a rising wedge signals further downside pressure.
- Key support zones lie at $0.221 and $0.205, with a deeper correction possible toward $0.150.
Get started on WEEX with a simple 40 USDT reward. Deposit 100 USDT, make your trade, and claim the bonus.
Analyzing the Charts
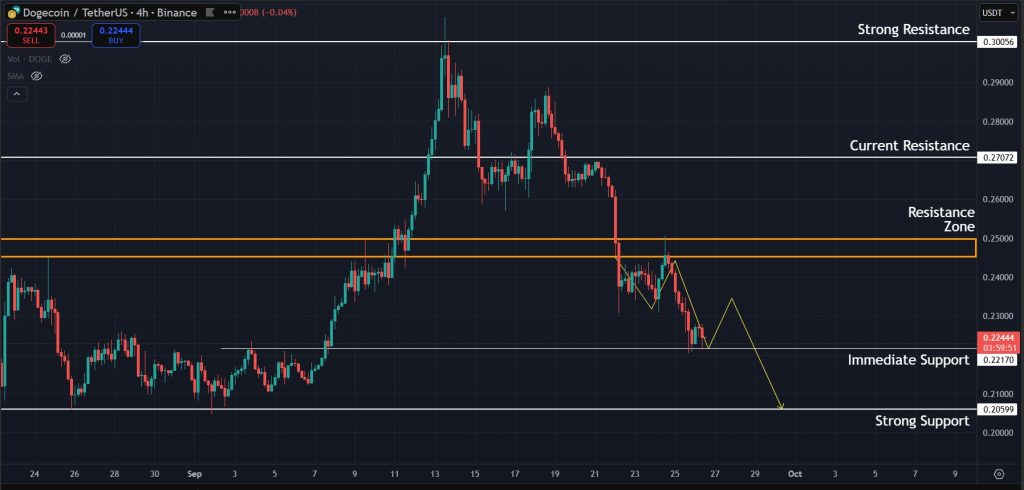
DOGE Price Action on the 4H Chart
Looking at the 4-hour chart for DOGE, the price recently retested the $0.250 zone after breaking below it, but the level acted as resistance and pushed the price back down. A green candle with a long wick shows that bulls tried to reclaim this area, yet selling pressure proved stronger. The next support to watch is at $0.221, although this level is already showing weakness. If it breaks, attention will shift toward the $0.205 mark, where bulls will likely make a stronger stand.
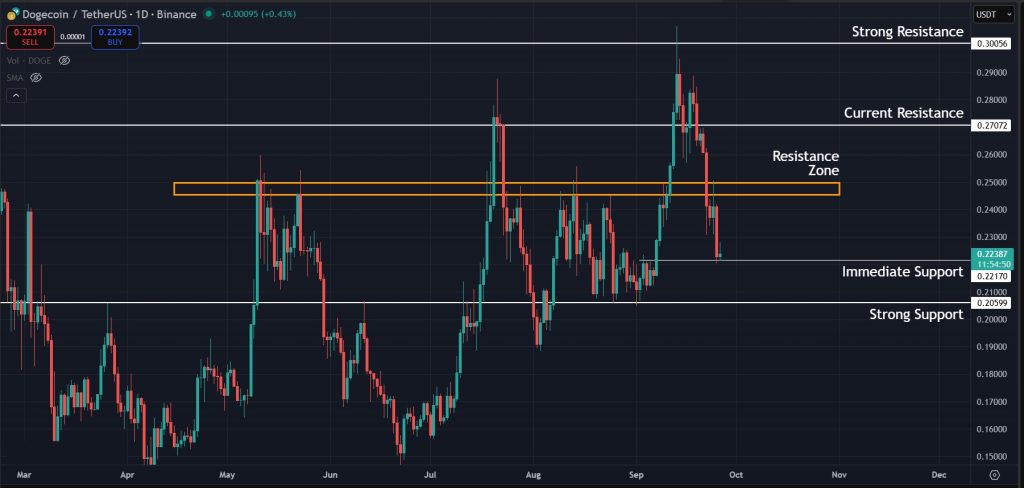
Critical Resistance at the $0.250 Zone
Switching to the 1-day timeframe, the picture becomes clearer as the $0.250 region stands out as a crucial zone that has acted as major resistance since Q2 of 2025. With the price now trading below this level, a retest is possible, but if market conditions remain the same, the likelihood of another rejection around this zone is high.
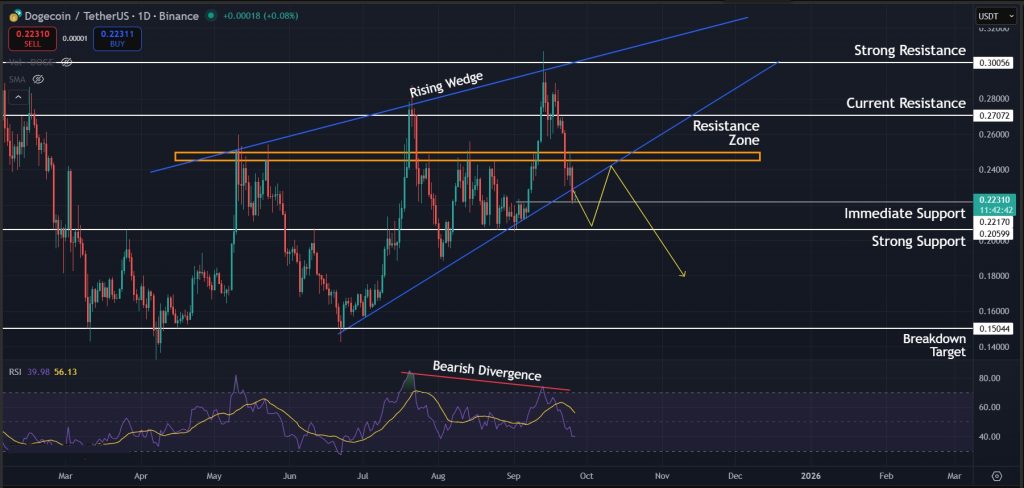
Rising Wedge & Bearish Divergence on the Daily Timeframe
While the $0.250 zone remains important, the key detail on the 1-day timeframe is the rising wedge pattern that DOGE appears to be breaking below. A rising wedge is a bearish formation that often signals an uptrend losing momentum. If this pattern plays out fully, the correction could extend further in the short term. The main support to watch is still at $0.205, with the breakdown target for the pattern sitting near the $0.150 mark. There is also a bearish divergence on this timeframe, with price forming higher highs while the RSI prints lower highs, which adds to the likelihood of a correction. Taken together, these factors explain why our current DOGE price prediction leans bearish.
Final Takeaway: What Is Next for DOGE?
In conclusion, DOGE remains under pressure as the charts point to continued bearish sentiment in the short term. The failed hold of the $0.250 support, the breakdown from the rising wedge, and the bearish divergence on the daily timeframe all suggest that sellers are in control for now. The immediate levels to watch are $0.221 and $0.205, with the latter standing as the key support zone. If these levels fail to hold, the correction could extend toward $0.150. On the other hand, any recovery attempt will first need to overcome resistance at $0.250, which has capped the price since mid-2025. Until buyers reclaim that zone, indicators show that downside risks remain higher for DOGE.
Join WEEX and unlock 40 USDT back with your first deposit-and-trade step. Deposit 100 USDT and start trading.
Disclaimer: All content on The Moon Show is for informational and educational purposes only. The opinions expressed do not constitute financial advice or recommendations to buy, sell, or trade cryptocurrencies. Trading involves significant risk and may result in substantial losses. Always seek independent financial advice before making investment decisions. The Moon Show is not responsible for any financial losses or decisions made based on the information provided.
Please view the full disclaimer at: https://themoonshow.com/disclaimer

HYPE Drops Toward $60 As Chip Selloff Hits Crypto
HYPE dropped toward $60 on July 17 as a chip-led selloff pulled risk assets lower. The token fe...

ONDO Surges as DTCC Tokenized Stock Push Brings Wall Street Rails Onchain
ONDO became one of the market’s stronger movers after Ondo launched tokenized stock representat...

Chainlink Tests $8.40 As Mantle’s CCIP Move Puts LINK Back In Focus
Chainlink is getting fresh attention after Mantle moved its $2.5B+ Super Portal from LayerZero ...