 Price Analysis (Jul 23, 2025): Third Wave Builds as Price Stalls Below $120K")
Bitcoin (BTC) Price Analysis (Jul 23, 2025): Third Wave Builds as Price Stalls Below $120K
Bitcoin is still trading near the $118,000 level and continues to trade sideways on lower timeframes. As highlighted in the last update, the $120,000 resistance remains intact and is capping any upward move for now. Altcoins have taken the spotlight, which has made it harder for Bitcoin to gather momentum. On the 4-hour chart, the price did break out of the bullish pennant pattern we mentioned earlier, but the move quickly lost steam after getting rejected at $120,000. Let’s break down the latest chart to see where the price is heading in the coming days.
Get started on WEEX with a simple 40 USDT reward. Deposit 100 USDT, make your trade, and claim the bonus.
Analyzing the Charts
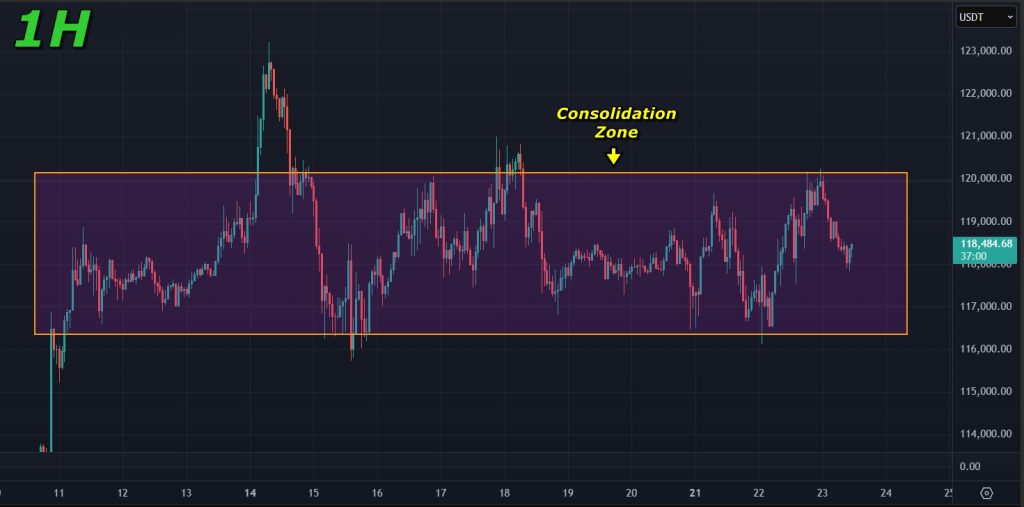
The 1-hour chart shows Bitcoin stuck in a tight consolidation range just below the $120,000 resistance. Price has repeatedly tested this level but hasn’t managed a clean breakout yet, suggesting that sellers are still active in this zone
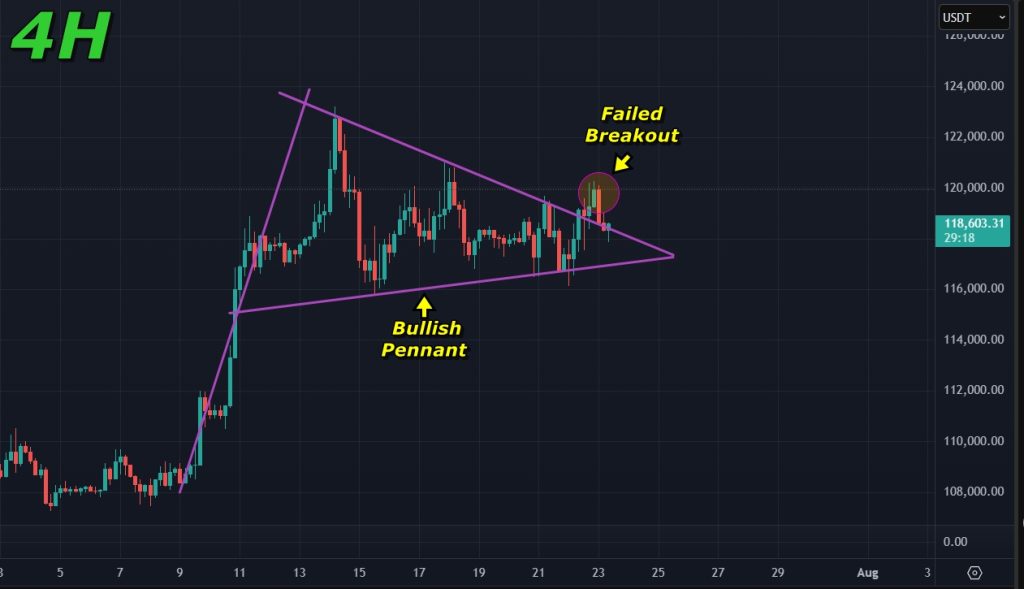
Shifting to the 4-hour chart, Bitcoin managed to break out of the bullish pennant pattern that had been forming over the past few days. However, the breakout lacked conviction and failed to push through the $120,000 resistance, which remains a major hurdle. Instead of following through with a strong move, price quickly pulled back, making it a weak breakout rather than a clear trend continuation. If Bitcoin manages to hold above the pennant structure, there’s still a chance of a retest and another attempt at $120,000. But with current price action showing low momentum, a period of sideways consolidation remains the more likely outcome for now.
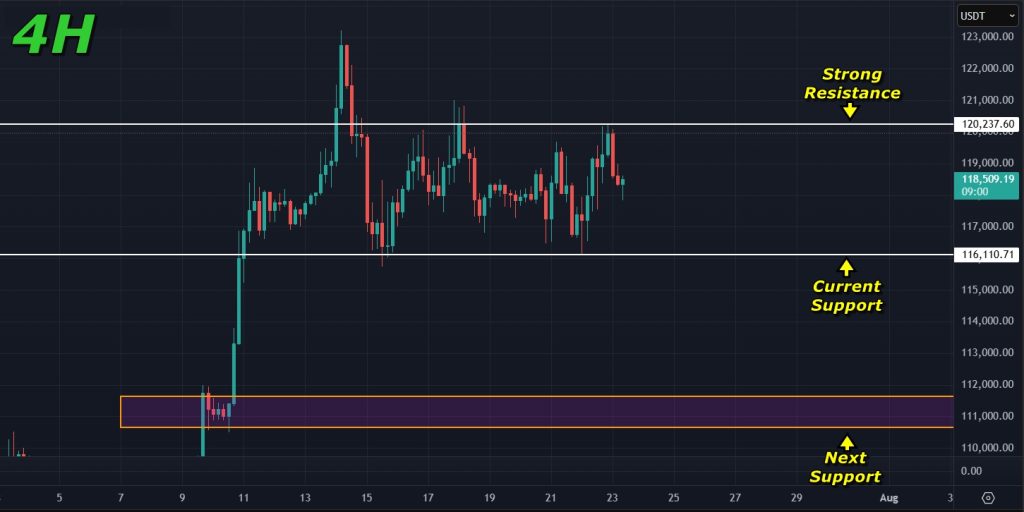
If Bitcoin starts to pull back from here, the first support to watch lies at the lower end of the current consolidation zone near $116,000. This level has held multiple times and will be key in determining short-term direction. If it breaks, the next major support sits near the $112,000 zone, where a cluster of previous demand and liquidity rests. A move into that area could also suggest a deeper correction is underway.
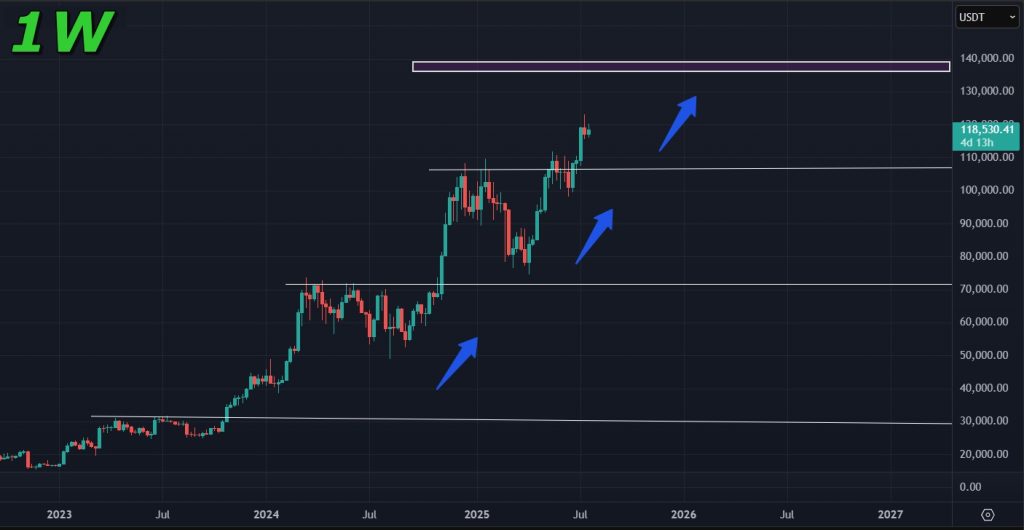
Looking at the weekly chart, Bitcoin appears to be entering its third impulsive wave since the start of this bullish cycle. The broader trend still leans bullish, and with fundamentals holding strong, another leg up remains likely before any significant correction kicks in. Based on the current structure, the Bitcoin price prediction points toward a possible move to new all-time highs in the $135,000 to $140,000 zone. While a correction is due, it may come after this next move plays out.
Final Takeaway: What is Next for Bitcoin (BTC)?
Bitcoin is trading just below the $120,000 mark and moving sideways on the lower timeframes. The $120,000 resistance is proving hard to break, but the overall structure still leans bullish. As long as price holds above key support levels like $116,000, the uptrend remains intact. A move toward the $135,000 to $140,000 range is still possible before a deeper correction sets in.
Start trading on WEEX with a 100 USDT deposit and unlock 40 USDT back after completing your first trading step.
Disclaimer: All content on The Moon Show is for informational and educational purposes only. The opinions expressed do not constitute financial advice or recommendations to buy, sell, or trade cryptocurrencies. Trading involves significant risk and may result in substantial losses. Always seek independent financial advice before making investment decisions. The Moon Show is not responsible for any financial losses or decisions made based on the information provided.
Please view the full disclaimer at: https://themoonshow.com/disclaimer

HYPE Drops Toward $60 As Chip Selloff Hits Crypto
HYPE dropped toward $60 on July 17 as a chip-led selloff pulled risk assets lower. The token fe...

ONDO Surges as DTCC Tokenized Stock Push Brings Wall Street Rails Onchain
ONDO became one of the market’s stronger movers after Ondo launched tokenized stock representat...

Chainlink Tests $8.40 As Mantle’s CCIP Move Puts LINK Back In Focus
Chainlink is getting fresh attention after Mantle moved its $2.5B+ Super Portal from LayerZero ...