 Price Analysis (01 July 2025): Sideways Action Persists, June’s Green Candle Signals Bullish Hope")
Bitcoin (BTC) Price Analysis (01 July 2025): Sideways Action Persists, June’s Green Candle Signals Bullish Hope
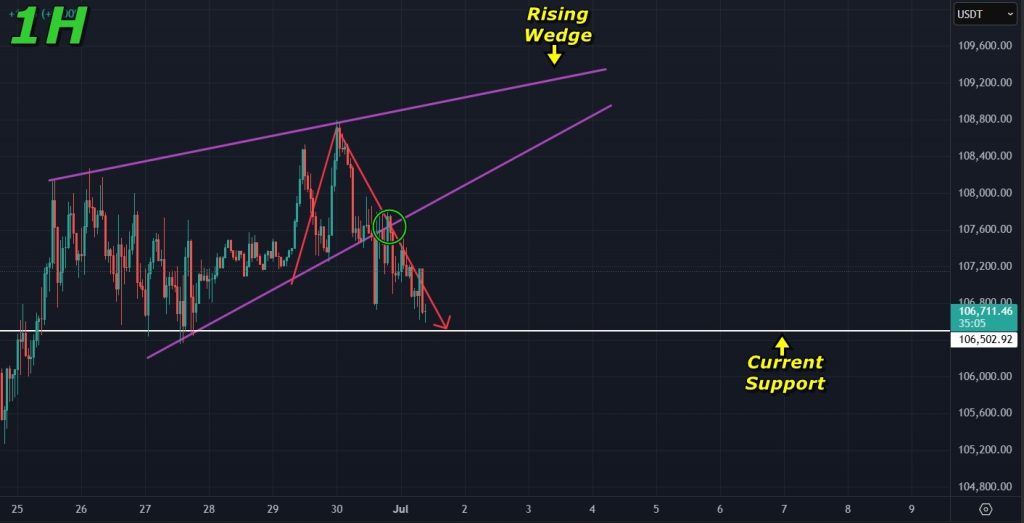
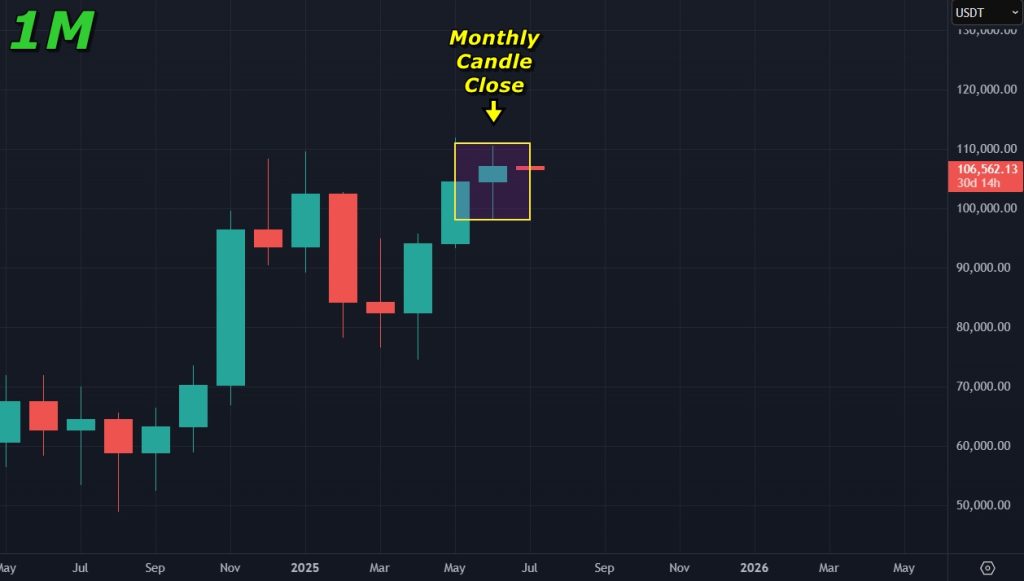
Bitcoin is currently trading around $106,700, still consolidating on the lower timeframes. As we noted in our previous analysis, the 1-hour chart was forming a rising wedge, and we called a breakdown. That played out as expected, with the price breaking below the wedge and holding key support at $106,500. It’s also worth noting that June’s monthly candle closed green, which is a bullish signal for Bitcoin. With momentum looking pretty flat right now, we can expect BTC to keep drifting sideways in the near term. Let’s dive into what could happen next in the short term:
Analyzing the Charts
On the 1-hour chart, Bitcoin broke below the rising wedge pattern after trading inside it for a few days and is now retesting the $106,500 support. This level is holding firm for now on the lower timeframes, which is encouraging. It’ll be interesting to see whether BTC bounces from here or, with low volume in play, slips below this support.
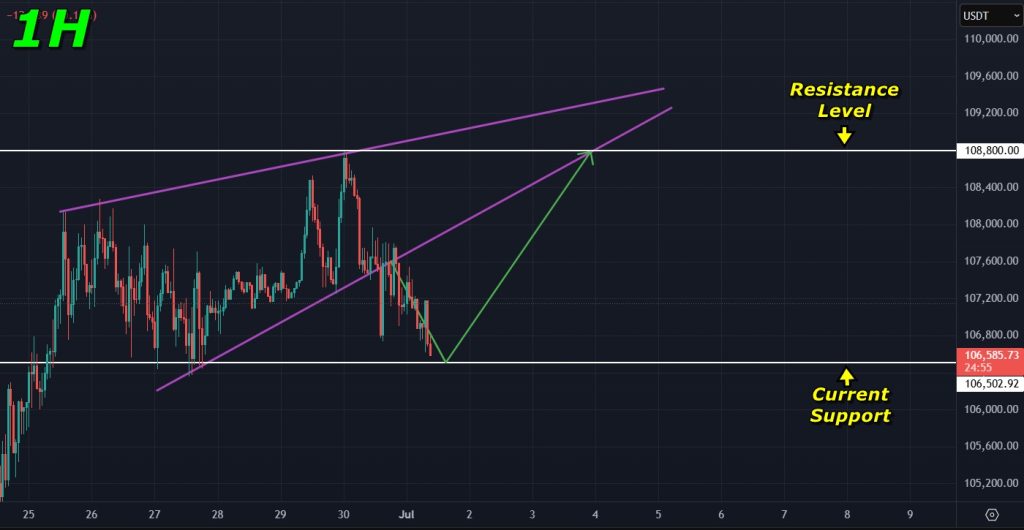
There’s also a decent chance Bitcoin could bounce from the $106,500 support if volume picks up, potentially forming green candles on the lower timeframes. Should that happen, our next target to watch is the horizontal resistance around $108,800, which could act as a ceiling for any near-term rally.
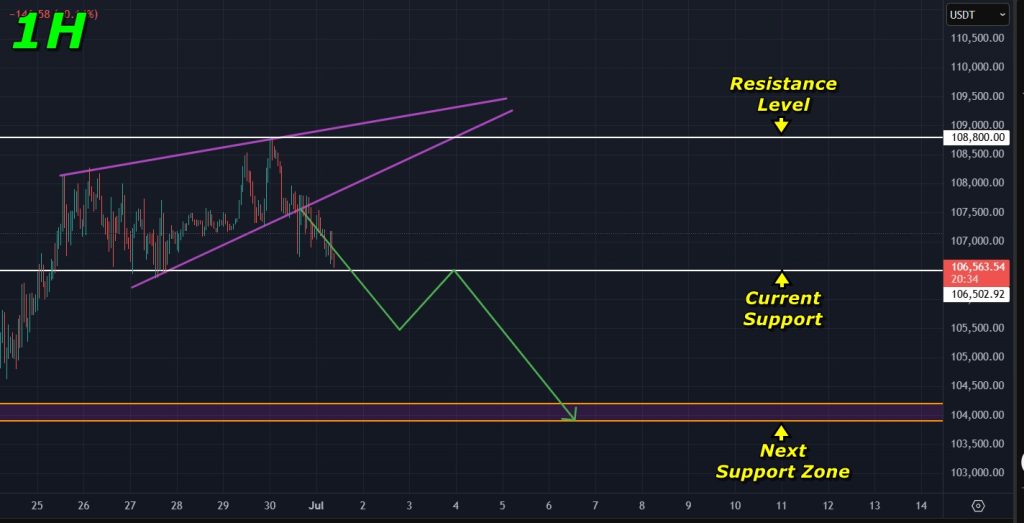
On the flip side, given the current lack of momentum, Bitcoin might break below the $106,500 support and retest lower levels with some consolidation before picking up steam. In that case, we’re eyeing the $104,000 region as the next major support to watch, where buyers could step in to defend the price.
Zooming out to the 1-month chart, Bitcoin’s June candle closed green, which is a bullish signal that suggests potential strength in the longer term. This aligns with the broader uptrend and keeps the macro outlook positive for BTC.
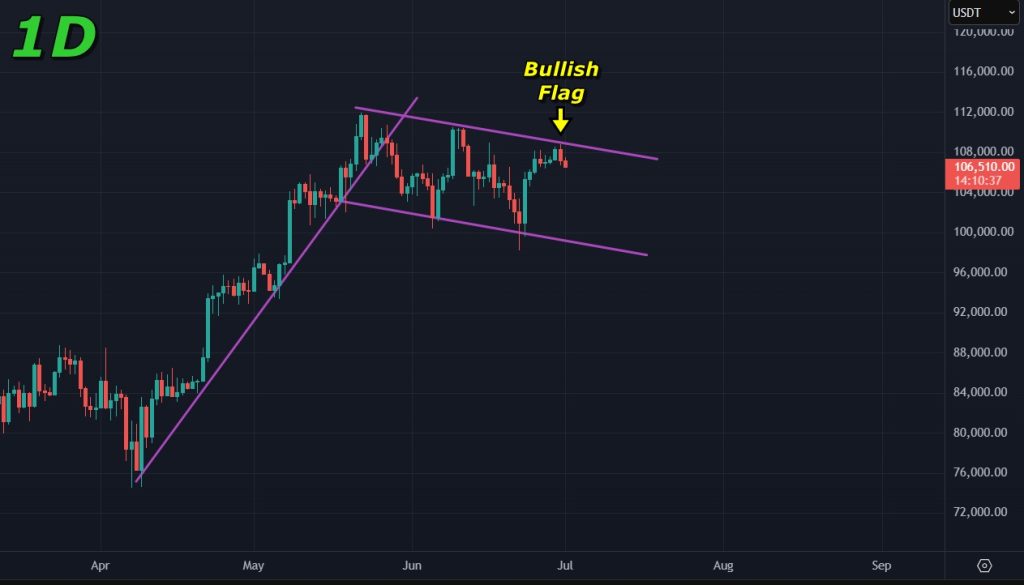
Furthermore, on the 1-day chart, Bitcoin is still trading within a bullish flag pattern, which could play out in the coming days if momentum picks up. However, the market’s been sluggish lately, with mostly sideways movement and lower-than-usual volatility, so we might need to wait for a catalyst to spark a breakout.
Important Reads: How to Buy Bitcoin
Final Takeaway
Bitcoin is sitting around $106,700, consolidating on the lower timeframes with little momentum. The $106,500 support is holding for now, but low volume could push it lower to test $104,000, or a pickup in buying could drive it toward $108,800 resistance. The green June monthly candle keeps the longer-term outlook bullish, but the daily chart’s sluggish bull flag pattern suggests we need a catalyst for a breakout. For now, we’re staying on the sidelines, waiting for a clear move above $108,800 or a drop to $104,000 before placing any trades.
Your $30,000 bonus + 10% discount are waiting on Bybit! Sign up and claim these rewards before they're gone. Time's ticking!
Disclaimer: All content on The Moon Show is for informational and educational purposes only. The opinions expressed do not constitute financial advice or recommendations to buy, sell, or trade cryptocurrencies. Trading involves significant risk and may result in substantial losses. Always seek independent financial advice before making investment decisions. The Moon Show is not responsible for any financial losses or decisions made based on the information provided.
Please view the full disclaimer at: https://themoonshow.com/disclaimer

HYPE Drops Toward $60 As Chip Selloff Hits Crypto
HYPE dropped toward $60 on July 17 as a chip-led selloff pulled risk assets lower. The token fe...

ONDO Surges as DTCC Tokenized Stock Push Brings Wall Street Rails Onchain
ONDO became one of the market’s stronger movers after Ondo launched tokenized stock representat...

Chainlink Tests $8.40 As Mantle’s CCIP Move Puts LINK Back In Focus
Chainlink is getting fresh attention after Mantle moved its $2.5B+ Super Portal from LayerZero ...